Lab 11: Human Electroencephalography (EEG)
Acknowledgements
Originally written by Allison Fisher and Marguerite Butler 11/06/2023
Additional material for this lab was borrowed and adopted from
- Electroencephalography Protocol. Written by Staff of ADInstruments for LabChart 8.
- Read the lab manual below.
- Write the [Prelab] in your lab notebook. Please DO NOT copy the lab manual word for word. Your task is to summarize the important points that are useful for developing hypotheses for this experiment.
- This week, draft hypotheses for each experiment.
- To obtain feedback from your TAs, for the prelab please have the hypotheses, figuring out how many ideas you have to cover, and writing a topic sentence for each paragraph:
- Umbrella idea
- introduce mechanism 1
- introduce mechanism 2
- …
- end with a paragraph of your hypotheses
- For the methods, outline:
- subjects
- equipment
- experimental treatments (be sure to note what variables are changing) and controls or comparisons
- analysis
- Do Quiz on Laulima (open 24 hrs before lab).
- Please bring a laptop with you to lab, if possible, to analyze your experimental results.
- We will explore the electrical activity of the human brain while doing various activities, using a technique called electroencephalography (EEG). There has been a lot of debate on various modes of study, we will test these ideas by measuring brain activity in two regions of the brain.
Background
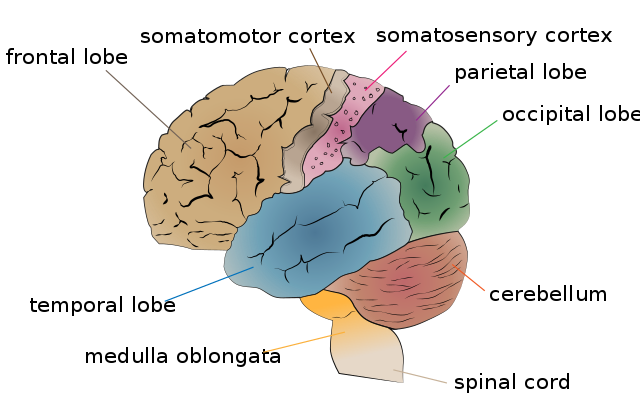
The cerebral cortex of the brain is the most developed in mammals and is a major center of information processing and integration (Figure 1). It plays a key role in many cognitive processes including attention, motor control and sensory-motor integration, memory, and language. The electrical activity of the brain can be measured non-invasively through electroencephalography (EEG, Vibell in prep, link), and furthermore can be used to monitor brain waves associated with behaviors.
In humans the different regions of the cerebral cortex have been mapped to different functions (Figure 1). For example the frontal lobe integrates many different processes including inputs, outputs, and control of movements (motor behavior), speech, and other behaviors, as well as cognitive and emotional processes. Humans are able to synthesize and prioritize the numerous inputs to produce optimal responses to changes in our environment. The occipital lobe plays a major role in visual processing. It is involved in object and facial recognition, depth perception, color recognition, and relays visual information to other regions of the brain. It receives visual information from the retina, but also receives input from other regions of the brain.
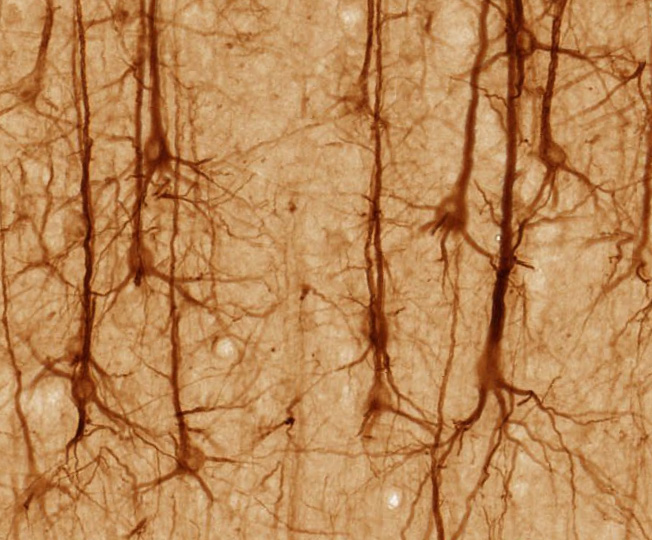
EEG is measuring electrical activity from cerebral cortex using skin surface electrodes on the scalp. Although the human brain has about 100 billion neurons, the electrical signals emitted by neurons are weak and have to pass through the cerebrospinal fluid, skull, scalp, and hair before being detected by the electrodes. The EEG technique takes advantage of the fact that the outermost portion of the cerebral cortex have neurons with a particular arrangement of their synapses such that they are all aligned and pointed outward (called “open field”) so that their electrical dipoles align and their signals sum (Vibell in prep). Thus what we are actually measuring are the summed activities of a large number of so-called pyrimidal neurons (Figure 2 (a)) near the electrodes.
Pyrimidal neurons are the most numerous excitatory neurons in the cerebral cortex (Bekkers 2011). They transform the sum of synaptic inputs into patterns of action potentials which may travel to other regions of the brain, or to muscle targets far away in the body to signal motor behavior. When we perform EEG we are measuring the activities of many (100s of thousands of) pyrimidal neurons as they go about processing information and coordinating activity.
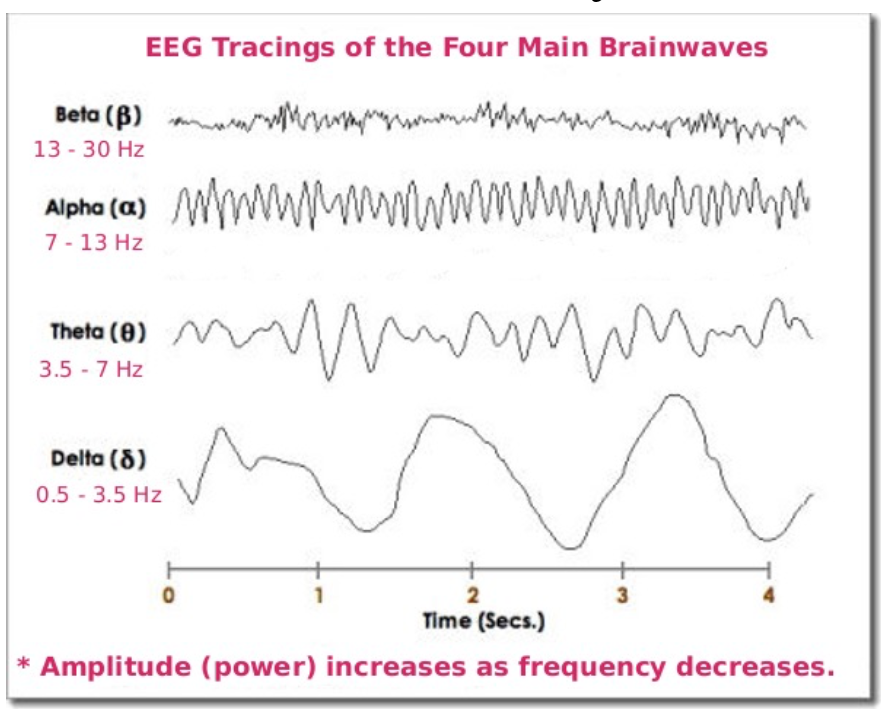
Brain waves can be classified by frequency bands. This means that they have characteristic patterns of oscillation over time (Figure 2 (b)). One of the earliest uses of EEG was characterizing brain activity during sleep, which led to the definition of alpha (7-13Hz), beta (13-30Hz), theta (3.5-7Hz) and delta (0.5-3.5Hz) waves Table 1. These waves were originally defined during sleep, with the dominance of the different frequences changing with different stages of sleep. They were later discovered to occur with other behavioral states and brain activities.
| EEG pattern | Frequency (Hz) | Behavioral/Psychological State |
|---|---|---|
| Delta | 0.5-3.5 | Deep, restful sleep; vague dream states. |
| Theta | 3.5-7 | Visual imagery, imagery when falling asleep or just before awakening; light sleep. |
| Alpha | 7-13 | Awake, non-focused, relaxed, drowsy, or non-vigilant; Low level of environmental stimulation (for example when eyes are closed). |
| Beta | 13-30 | Awake, alert, focused attention or problem-solving; dream/REM sleep; high level of environmental stimulation (for example when eyes are open). |
| Gamma | 30-70, >70 | Associated with cognitive processing, correlated with large-scale brain networking. |
Alpha waves (8-12 Hz) can be measured spontaneously and are prominent over the occipital (visual) region of the brain. When our eyes are open and are in an alert state, alpha waves tend to be suppressed. They are prominent when the eyes are closed and we are relaxed (Table 1). You will do an “eyes open/eyes closed” experiment today. Beta waves increase when we are alert and are associated with focus or problem-solving. Gamma waves are associated with cognitive processing.
Brain function is extremely complicated and not perfectly understood. In particular, there is no easy one-to-one interpretation of brain frequencies with particular cogntive functions. In other words, there are likely to be countless processes that generate similar wave frequencies.
However, EEG is very good at detecting brain activity at great temporal and spatial resolution. The most sophisticated systems use 64-256 electrodes mapped across the brain and can provide spatial and temporal resolution in 3D.
We will be using only two sets of electrodes targeting the frontal cortex and the occipital cortex, enough to detect some spatial differences (i.e., frontal vs. occipital lobes), but we will have much better temporal resolution (allowing you to correlate brain activity with events, and hopefully you can obtain clean signals if you can keep the level of noise down).
Recently, there has been a lot of interest in using EEG to measure brain activity in an educational context. Many studies have established the benefits to learning of taking notes by hand or drawing over typing by computer (see studies cited in Meer and Weel 2017; Ose Askvik, Weel, and Meer 2020). However, whether these can be connected to brain activity is less clear.
- Meer and Weel (2017) found that a decrease of lower frequency waves in the theta/alpha bands when drawing over typing, implying that the brain is more receptive to learning.
- Describing words (paraphrasing) was associated with an increase in the upper alpha/beta/gamma range (higher frequency waves), especially during ideation (the formatiom of ideas).
- Ose Askvik, Weel, and Meer (2020) explored brain activity while writing in cursive vs. drawing vs. typing.
Your task today is to explore brain activity in the frontal and occipital cortex while the subject performs different tasks. Can you see changes in EEG pattern?
What you will do in the laboratory
- Setup. Check that the equipment are set up correctly and ready to record.
- Detecting artifacts. You will learn how to indentify artifacts produced by unwanted electrical acticity.
- Brain activity by notetaking strategy. You will explore the types of brain waves generated while copy text verbatim vs. taking notes in your own words vs. doodling, all of which are modes of interacting with learning materials. You will also compare printing vs. cursive writing vs. typing on a keyboard as well as reading silently (with no notes).
- Your own experiments.
Equipment
- PowerLab data acquisition system
- LabChart 8 or later
- 5 Lead Shielded Bio Amp Cable
- EEG Flat Electrodes
- Electrode Cream or Paste
- Alcohol Swabs
- Ace Bandgage
- Tape
Procedure
Subject preparation
Make sure the PowerLab is turned off and the USB cable is connected to the computer.
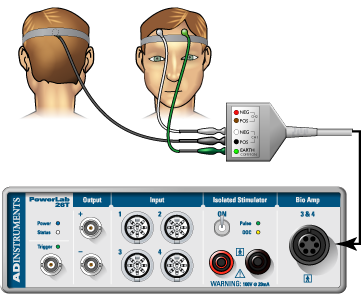
Connect the 5 Lead Shielded Bio Amp Cable to the Bio Amp Connector on the front panel of the PowerLab (Figure 3). The hardware needs to be connected before you open the settings file.
Remove any jewelry from the volunteer’s face, ears, and neck.
Unwind and straighten all of the flat electrodes. Attach the leads of the EEG Flat Electrodes the pins closest to the labled side of the Bio Amp Cable. You will need all 5 leads.
Refer to (Figure 3) for proper electrode placement, but note that we will be using 5 electrodes: two on the frontal lobe and two on the occipital lobe, and a ground.
- Frontal lobe: Channel 1 “positive” and “negative” electrodes will be 3-4cm apart on either side of the forehead.
- Occipital lobe: Channel 2 “positive” and “negative” electrodes will be 3-4cm apart on the back of the head (where the skull bulges out). Place the
- Earth electrode on the bare skin on the bone just behind the ear on the left side.
For the occipital lobe, it helps to part the hair across the back of the head from side to side to expose the electrode area for the occipital lobe and use hair pins to keep the hair out of the way. For long-haired subjects, rubber bands to make a top-knot ponytail may help.
You can use a ballpoint pen to lightly mark the skin if you wish. Let the subject abrade their own skin with a fingernail or an alcohol swab to remove dead skin cells. Abrasion helps reduce the skinʻs resistance.
Apply electrode Paste to the EEG Flat Electrodes. When the skin is dry stick the electrodes to the skin (Figure 3) and keep the electrodes and wires in place with the medical tape. Avoid air gaps. Wrap the ACE bandage around the head to press the flat electrodes snugly on the head in good contact with the skin.
Have the volunteer seated in a comfortable position at the table with paper and pen and a laptop in front of them. During the experiment is important to minimize muscle movement and ensure that none of the electrodes are disturbed or compressed.
Check that all five electrodes are properly connected to the volunteer and the Bio Amp Cable before proceeding. Make sure the electrode wires do not cross over any power cables or electronic equipment. Turn on the PowerLab. (Figure 3).
Software Setup
Start Chart using the EEG lab settings file. Four channels should appear: the EEG frontal and EEG occipital, Alpha power frontal, and Alpha power occipital.
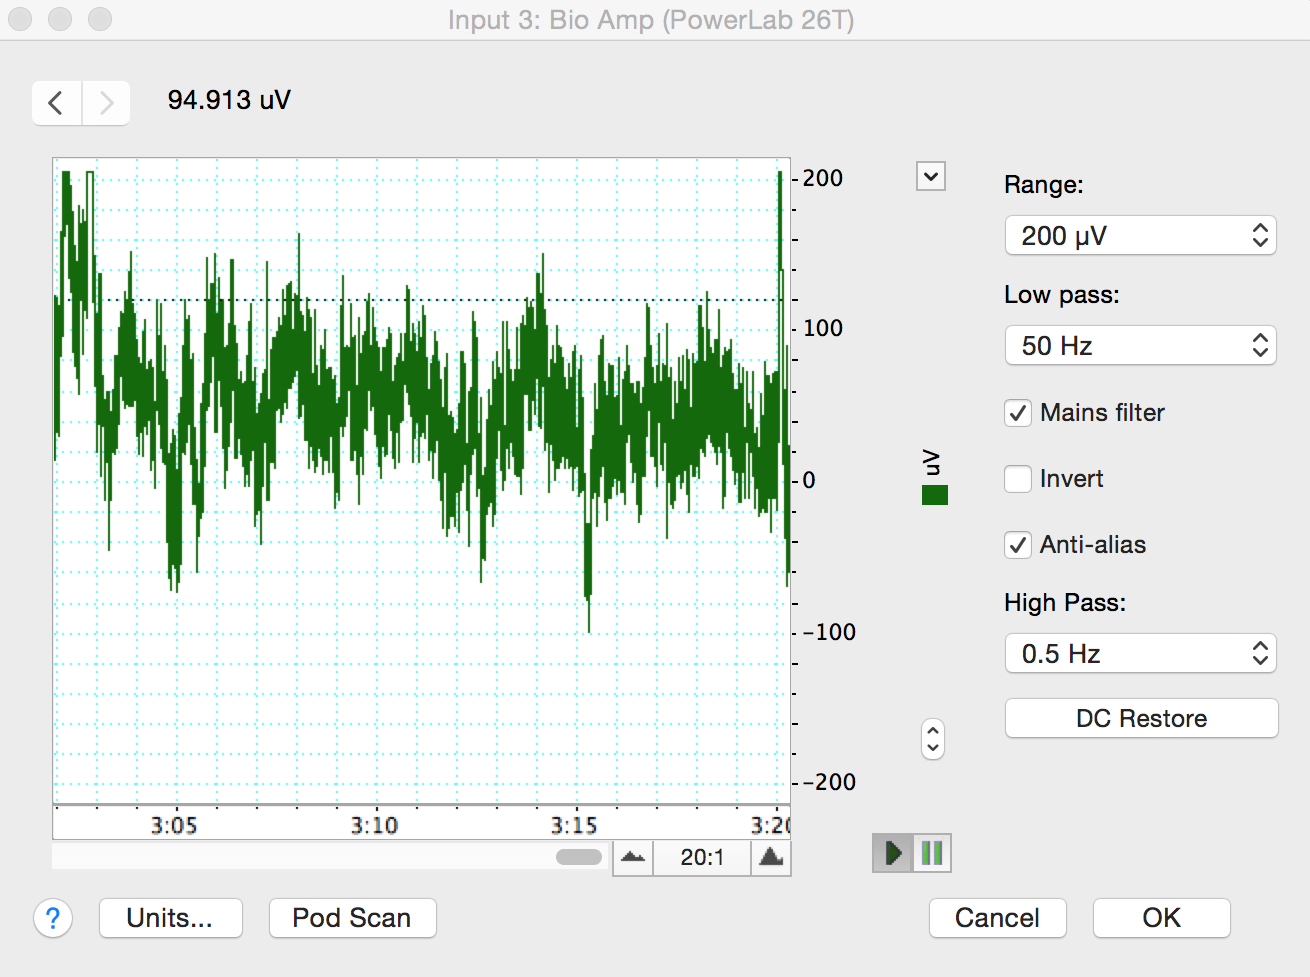
Make sure that the EEG channels are set to the “Bioamp”. Make sure the settings are as follows: Range 200 \(\mu\)V, High Pass 0.5 Hz, and Low Pass 50 Hz (Figure 4). Check that the spectral input is reading the channels for the EEG. You may have to change the inputs to match the correct channel number. If you are using the new setup, you may have to change and restart Chart (several times) with the Bioamp cable connected for it to appear in the menu. If you are using the old setup, the little green light on the front of the Bioamp should be on. Ask your TA for help if needed.
Exercise 1: Recognizing Artifacts
Start recording. Ask the volunteer to blink repeatedly and add a comment “blinking”. Stop recording after 10 seconds.
Record the volunteer making eye movements. Add a comment “eye movements.” Have the volunteer gaze up-and-down and left-and-right in a repeated pattern. Make sure the volunteer is keeping their head still and only moving their eyes.
Record the volunteer making head movements.
Record the volunteer making jaw movements.
Record the volunteer swallowing.
Save your data, and open a new file with the same settings.
Analysis Exercise 1: Recognizing Artifacts
Examine the vertical scale at the left of the Chart View, and note the positions corresponding to +50 \(\mu\)V and –50 \(\mu\)V. True EEG signals rarely exceed these limits.
Examine the entire data trace and Autoscale, if necessary. There may be some large signals outside the ±75 \(\mu\)V range. Such large signals are artifacts.
Exercise 2: Alpha Waves in the EEG
In this exercise, you will examine the effects of relaxation and eye movement on alpha waves in the EEG.
Make sure the volunteer is relaxed and comfortable. Have the volunteer close his/her eyes and remain quiet. Keep noise to a minimum and keep all distractions away from the volunteer.
Start recording. Record for 30 seconds. Prepare a comment with “open;” do not enter it yet.
Tell the volunteer to open both eyes. Immediately press Return/Enter to add the comment. The subject should not be reading anything or moving their eyes around. Keep head, neck, and eyes very still with the gaze focused on a single point in front of them. Record with the volunteer’s eyes open for 10 seconds. Do not stop recording.
Prepare a comment with “shut.” When the 10 seconds are complete, tell the volunteer to close both eyes. Immediately press Return/Enter to add the comment.
Repeat steps 3 and 4 twice, to give you three sets of results. Save your data.
Analysis Exercise 2: Alpha Waves in the EEG
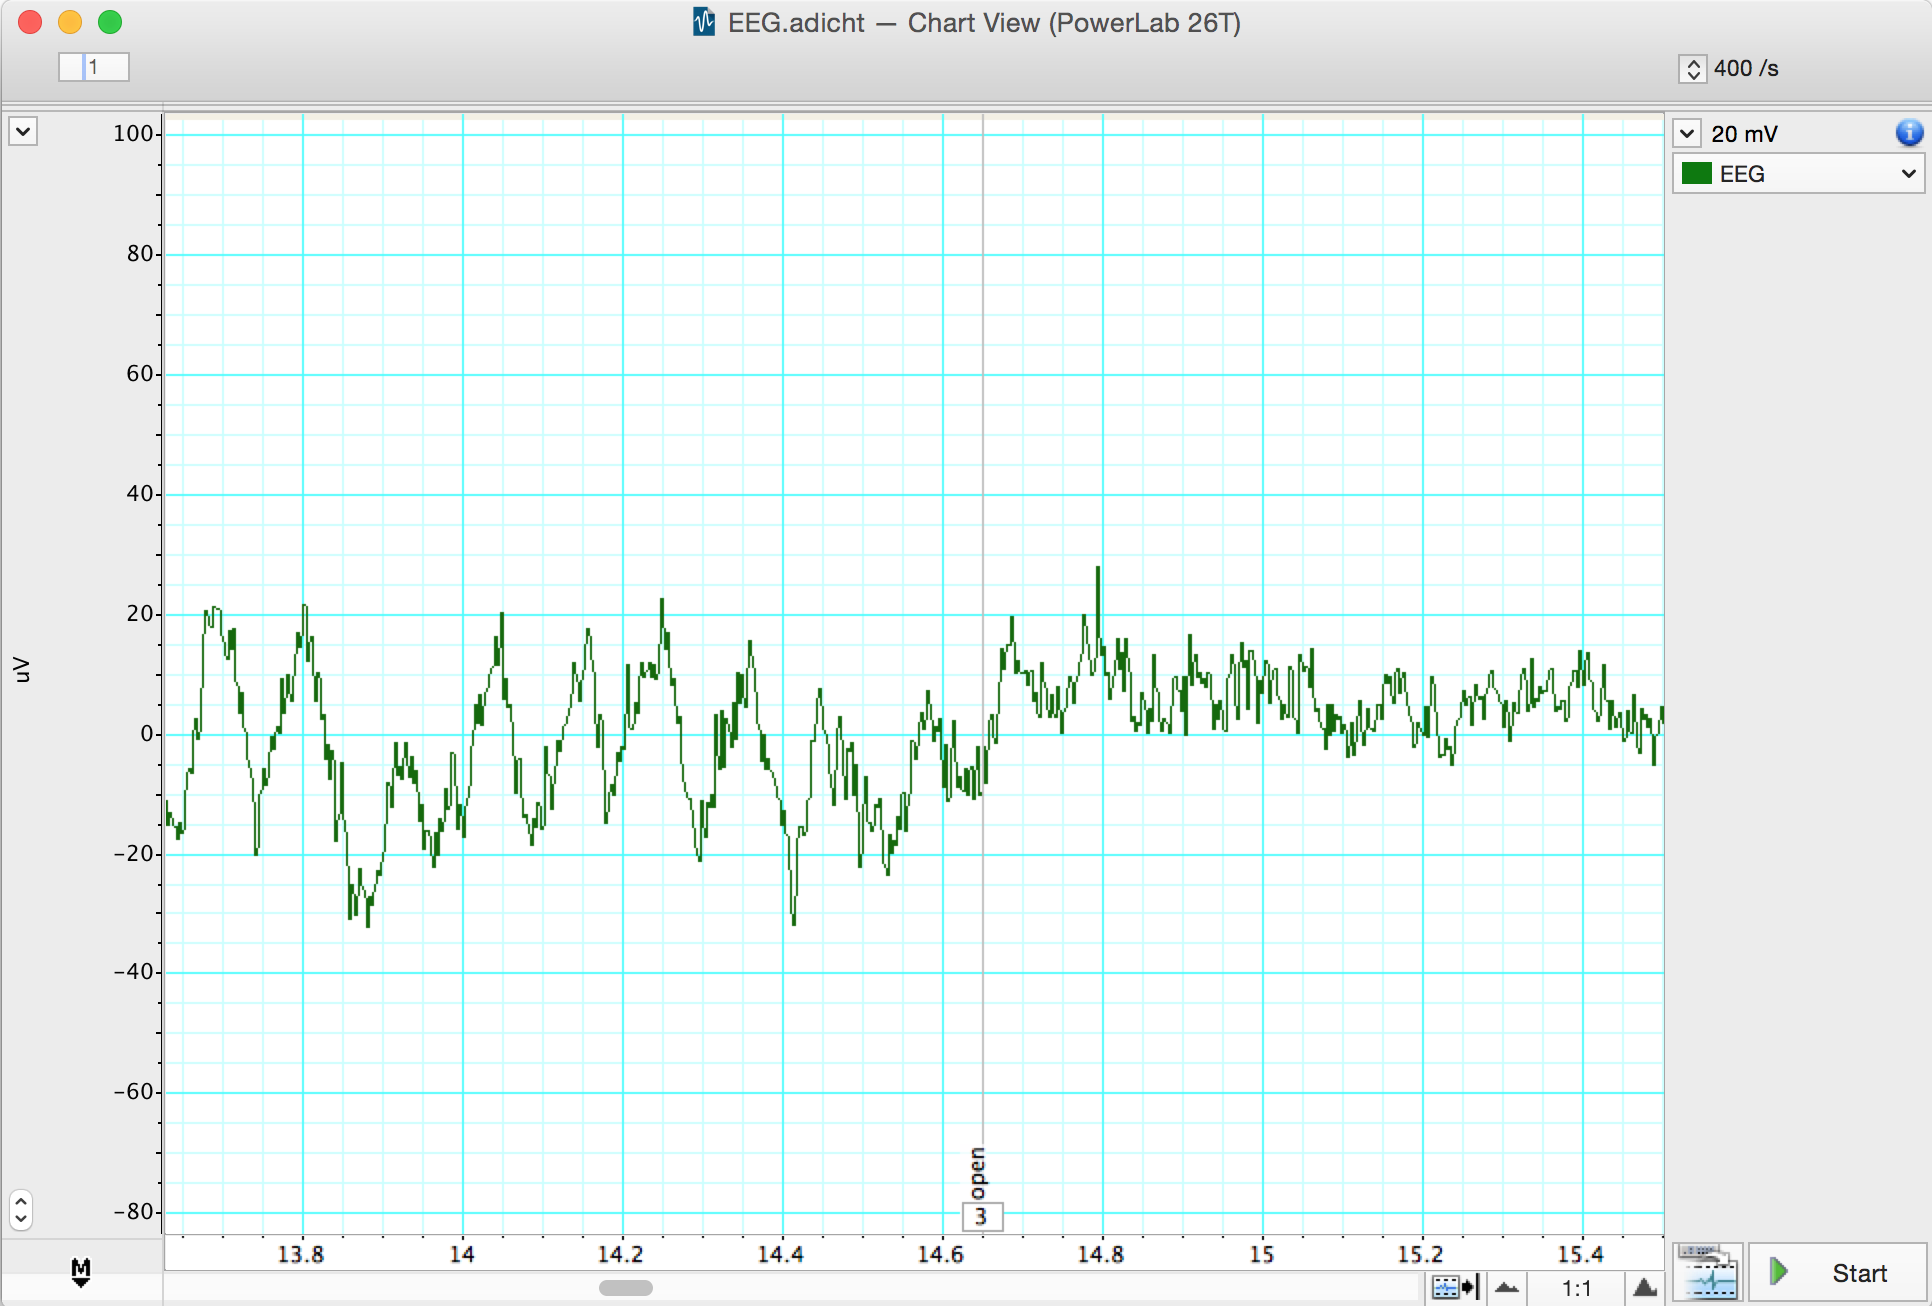
- Examine the entire data trace. Use the View Buttons to change the horizontal compression to see data with eyes open and shut. Make a data selection that includes some data from both eyes open and eyes shut conditions. View this selection in Zoom View. This should make it easier to see the alpha wave activity (Figure 5). Now Autoscale, if necessary.
- In Chart View scroll through the “eyes shut” recording to look for alpha waves. Use the View Buttons to change the horizontal compression if necessary. The alpha waves can be recognized by their amplitude (usually 30 to 50 \(\mu\)V peak-to-trough, although it can be quite variable) and their frequency. Each cycle of an alpha wave should last approximately 0.1 s.
Note: If you cannot find brain activity that matches the alpha rhythm, re-attach the electrodes and repeat this exercise.
Use the Marker and Waveform Cursor to measure the amplitude of the alpha waves. Place the Marker at the lowest point of the wave and move the Waveform Cursor to the peak of the wave. Measure the amplitudes of four waves from when the volunteer’s eyes were closed. Record the values in Table 2.
Now measure wave amplitudes when the volunteer’s eyes were open. Record these values in Table 3.
The amplitude of the waves is affected by the quality of the EEG signal. Therefore, it is useful to examine the frequency and power of the wave activity. Spectral analysis can be used to examine these features of a signal. Before examining your EEG signal you will complete a short tutorial on Spectral Analysis.
| Amplitude | |
|---|---|
| Wave 1 | |
| Wave 2 | |
| Wave 3 | |
| Wave 4 |
| Amplitude | |
|---|---|
| Wave 1 | |
| Wave 2 | |
| Wave 3 | |
| Wave 4 |
Spectral Analysis Tutorial
LabChart provides a module called Spectrum View that allows you to observe the frequency distribution of EEG data that might not otherwise be easily seen. For example, it could be used to break down an EEG waveform into its various components: beta waves, alpha waves, theta waves and delta waves. Spectrum view conducts a spectral analysis of the data by separting the complex EEG signal into its component waveforms which differ by frequency.
Specifically we will use the fast Fourier transform, which is one method of conducting a spectral analysis on the raw EEG data. It is more important, however, is for you to understand what this method is accomplishing. If we think of the EEG as the sum of many sine waves of many different frequencies, the spectral analysis splits the complex wave into individual wave forms and adds up the numbers of waves of each frequency.
What we see as a result is a plot of the power (y-axis) of different frequencies (x-axis) relative to each other in the input signal. Here power is equivalent to amplitude or a count of the numbers of waves at the given frequency along the x-axis. This is called a Power Spectrum Density (PSD) plot. The data can also be displayed as 3-dimensional color plot of spectral power, frequency, and time called a Spectrogram. (Donʻt get confused, frequency in this context refers to how many Hertz or cycles per second characterize each waveform, not the numbers of waves of each Hz we are counting - the power.)
Open the EEG Spectral Analysis Tutorial. It is in the Welcome Center, under the Experiments tab. It is also on the Animal Physiology Settings Folder.
Examine the Chart View. Use the View Buttons to view each block. You should see five blocks of data. The first record is a slowly oscillating sine wave
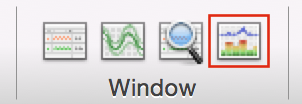
Open Spectrum view by clicking on the Spectrum View button in the Toolbar (Figure 6).
Click the Smart Tile button in the LabChart Toolbar to display both windows in full screen mode.
In Chart View Select the first record by double clicking in the Time axis. This will perform a spectral analysis for this record and displays the result in the Spectrum view. Adjust the horizontal scaling of plots to view the results:
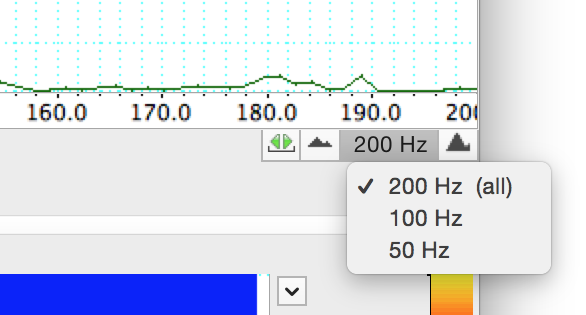
- Set the horizontal scaling for the Power Spectrum Density (PSD) plot to 50 Hz (Figure 7). Use the horizontal scroll bar to display the 0 Hz to 50 Hz region of the plot.
- Set the horizontal scaling for the Spectrogram to 50:1.
- Examine the PSD plot and then the first section of the Spectrogram. Expand the vertical axes if necessary. Use the waveform cursor to identify the frequency in Hertz (Hz) of the peak in the PSD plot and the band in the Spectrogram. Values are displayed at the top of each plot.
- What is the frequency in Hertz (Hz) of this sine wave? ______
- Select the second record and again view the result in the Spectrum view.
- What is the frequency in Hertz (Hz) of this second sine wave? _____
- Select the third record and again view the result in the Spectrum view. You should now see two prominent peaks (PSD plot) and bands (Spectrogram) in the result.
- Are these two peaks/bands the same as for the first two records? _____
- Select the fourth record and again view the result in the Spectrum view.
- Is there any regular signal within this record? _____
In Chart View compare the signal amplitudes of the fourth and fifth records. Note that the fifth record has lower amplitude compared with the fourth record.
Select the fourth record again. In the Spectrum view examine the PSD plot. Move the Waveform Cursor to the prominent peak.
What is the frequency (Hz) of this signal? _____
What is the power (mV2) of this signal? _____
- Select the fifth record and examine the PSD plot. Move the Waveform Cursor to the peak.
What is the frequency (Hz) of this signal? _____
What is the power (mV2) of this signal? _____
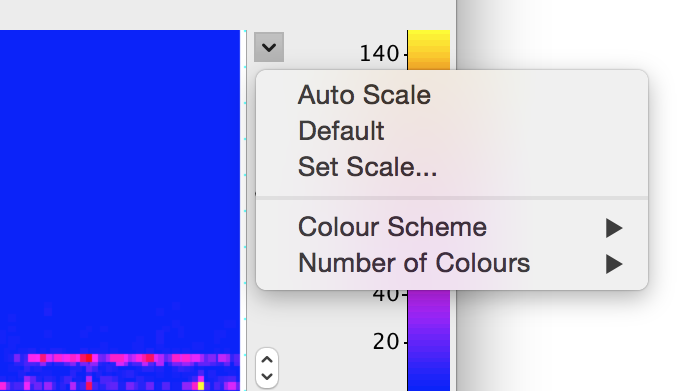
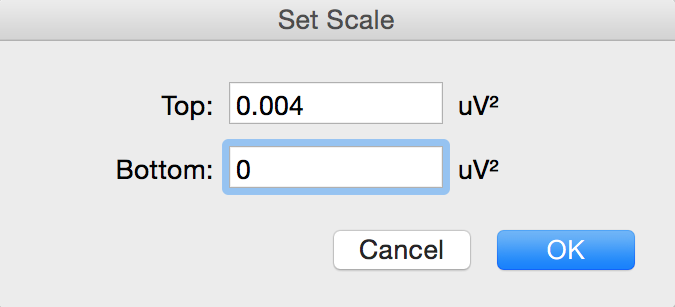
- Examine the Spectrogram. Note that the band corresponding to the signal’s frequency appears to missing. This is because the power of the signal is small compared with the previous four records. Expand the scale on the right hand side of the Spectrogram by setting the scale closer to the power of the signal (e.g., 0 to 0.004 V\(^2\)) (Figure 8, Figure 9). Note that the band is now visible at the expected frequency.
- The fifth record is the same signal as the fourth record, except that the quality of the raw signal has been affected. Compare your features (amplitude, power, frequency) of the fourth and fifth record.
- How has the quality of the signal affected the wave features? _____
Analysis Excercise 2: Alpha waves in the EEG
Now you will use Spectral Analysis to examine the EEG you recorded.
- Use the View Buttons to change the horizontal compression to 10:1 (Figure 10).
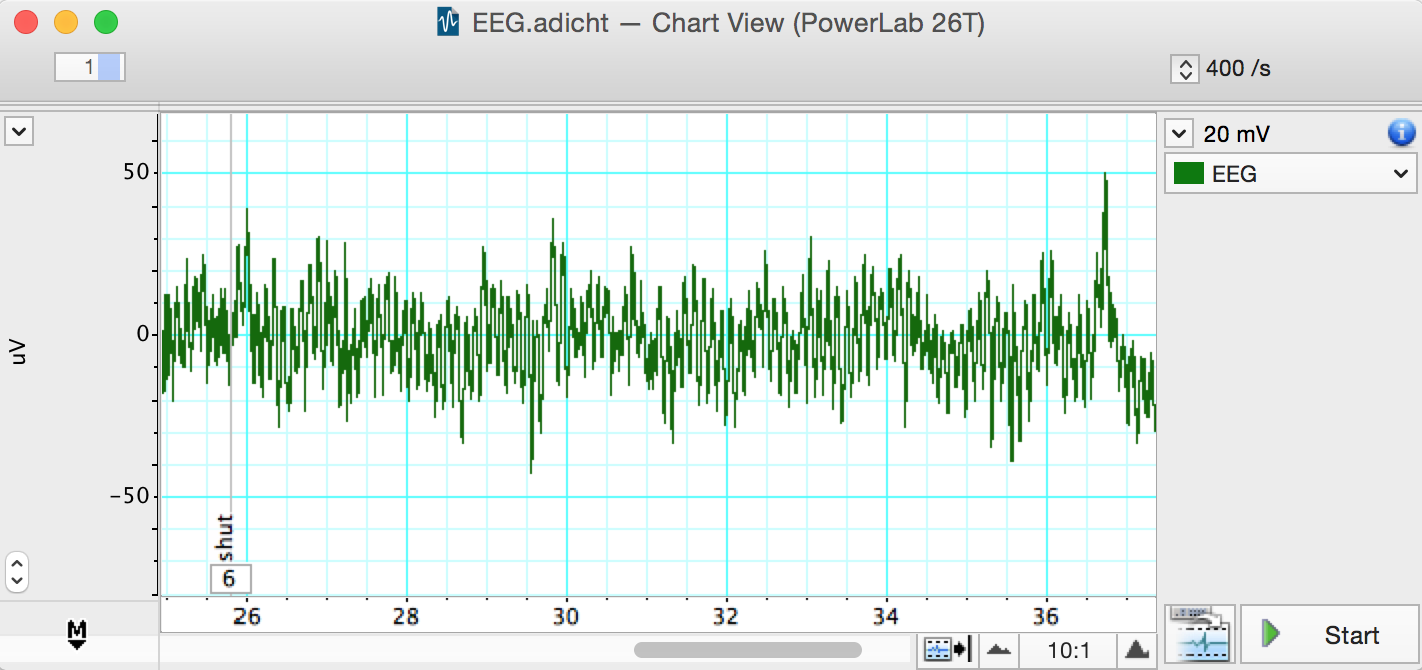
- Find the part of the recording when the volunteer had his/her eyes shut. Click-and-drag across this part of the raw data trace to select it. From the Window menu, select Spectrum. In the Spectrum View choose Selected (Figure 11).
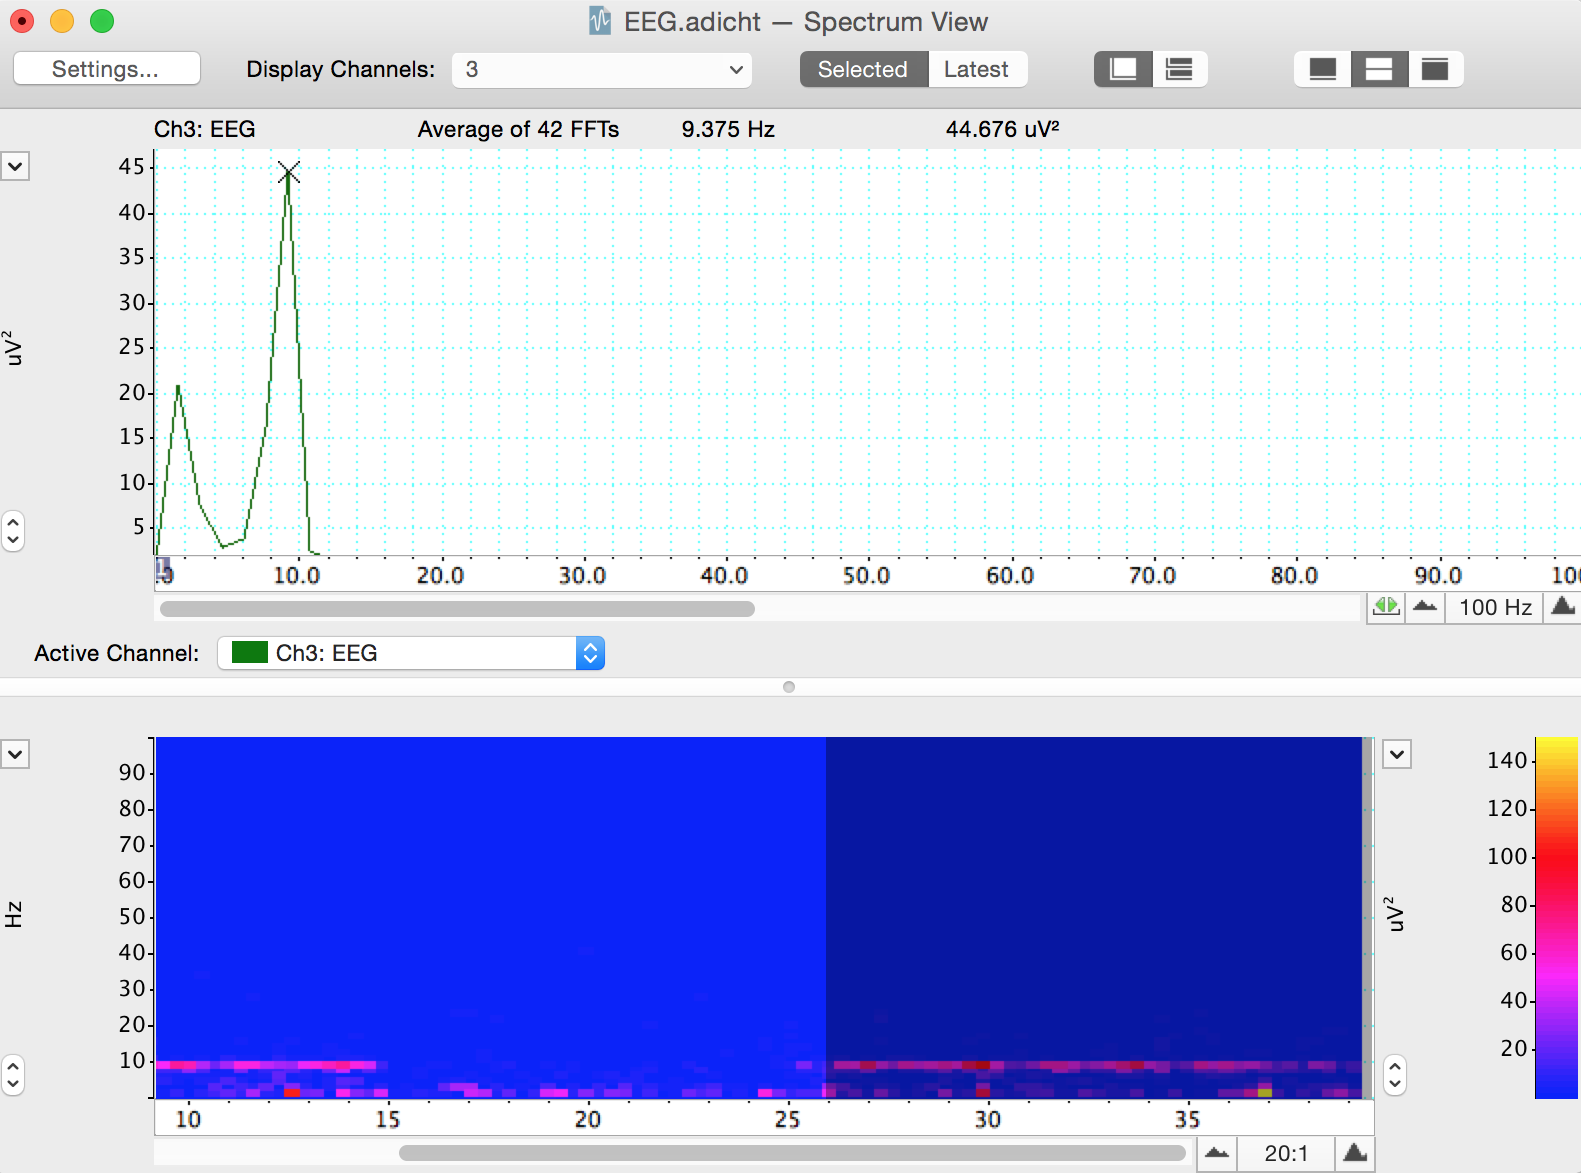
Alpha activity shows up in the PSD plot as a clear peak in the 8-12 Hz range. Then print the PSD plot.
Alpha activity shows up in the Spectrogram as a band of color in the 8-12 Hz range. If you cannot see the alpha activity as a clear peak in the 8-12 Hz range, scale the horizontal and vertical axes. Note that Spectrogram displays all the recorded data and that the selection you have made is highlighted in a darker blue color.
Make a data selection of several seconds from when the volunteer had their eyes open. Select Spectrum. Note that in the PSD plot the peak in the alpha activity range of 8-12 Hz is small or absent and in the Spectrogram the band of color in the alpha activity range of 8-12 Hz is weak or absent. Print the PSD plot.
In the Spectrogram scale the horizontal axis so that all the data is visible. Note the presence and absence of the band of color in the alpha activity range of 8-12 Hz which correspond with the eyes shut and eyes open conditions. Save a screenshot of the Spectrogram. You may want to include a representative spectrogram i upur lab report.
Exercise 3: Note Taking Strategies
In this exercise, you will compare abundance of different wave frequencies during various methods of note taking. We record from the frontal and occipital lobes.
- copying: reproducing information verbatim. Word-for-word.
- note taking: depicting the information content in your own words, whether in sentences, bullet points, or some more flexible format.
- drawing: doodling, drawimg, or making diagrams of the information, which can be labelled.
- reading only: The control. No note taking.
- handwriting (print)
- cursive writing
- typing
On the desk in front of the subject, there will be a paper with prompts for your learning activities. The experimentor will use a top sheet to cover the prompts, moving it down to expose the next line as you move through each experiment.
With the subject seated comfortably, start the recording and drop a comment saying “begin hand movement control”. As before during the eyes open/closed trials, the subject will open their eyes, not reading anything and holding very still. This time, have the subject gently move their hand as if they are writing/typing. Record for 30 seconds and drop a comment when done.
Position the pen and blank paper in front of the subject. Start the recording and drop a comment that says “begin handwritten copying”. Expose the first line on the prompt sheet and have the subject copy it using regular handwriting. Try to only move the hand and wrist while writing. Drop another comment when they have finished writing.
While still recording, drop another comment saying “begin handwritten notetaking”. Have the subject read the second prompt and take notes (in their own words) using the pen and paper. Drop a comment when finished.
Repeat steps 3 & 4 two more times. Instead of handwriting print, the subject will run through each trial (copy, note-taking) using cursive handwriting and then typing on a keyboard. Move through the prompts in order, ensuring each is new. Comment appropriately for each exercise (begin cursive copying, begin typing copying, etc.).
For the 7th prompt on the sheet, have the subject read the sentence and draw a diagram/picture to illustrate what the sentence describes.
For the 8th prompt on the sheet, have the subject only read the sentence (in their head) without doing any note-taking activity.
Design your own experiment to test another factor in note taking strategies. For example, having the sentence read aloud to the subject. Record this trial with appropriate commenting.
Analysis Excercise 3: Note Taking Strategies
Steps 1-3 must be done in class. You can not do this on your home version of LabChart.
Select a clean section of data in the Chart Window from the first experiment (without any major artifacts). Open the Spectrum view and change the settings to display both “EEG Frontal” and “EEG Occipital” channels.
In the top menu, select File -> Export -> Spectrum PSD Text file. This will create a text file with the relative abundance of waves at different frequencies for both the frontal and occipital regions. Save this file with a name corresponding to which treatment the data came from, for example, “Handwritten_Copying.txt”.
Repeat this exporting process for each combination of note taking mode (handwriting, cursive, typing), strategy (copying, note-taking, your choice) as well as drawing and reading only. Also do this process for “eyes open” and “eyes closed” data for control. You should have at least 12 text files total.
Make a copy of this Google sheet and share with your group members. Select the columns in each text file, copy, and paste them into Sheet 1 under the appropriate heading. If inserted correctly, formulas in Sheet 2 will populate with summed values for waves in the delta, theta, alpha, beta, and gamma frequency ranges. These values tell you the relative abundance, or power, of each type of wave during each experiment. By comparing wave type powers, you can see what types of brain activity are more prevalent in each region.
Now you can compare the abundance of different wave types in different areas of the brain for each activity. With your group, come up with at least 6 questions regarding brain activity during different modes of note taking and show us with appropriate comparisons of your data.
- One of your questions must include comparisons between alpha and beta waves in both brain regions during eyes closed and eyes open.
- For example, “Do we see a decrease in alpha waves and an increase in beta waves with eyes open?”
- Make a bar plot for eyes open treatments grouped by brain region versus alpha wave power. If parentheses indicates which bars are side-by-side, it would look like this: Along the x-axis you will have (frontal-eyes open, frontal-eyes closed) a gap, then (occipital-eyes open, occipital eyes closed). Make the same type of bar plot for beta wave power. Arrange the two plots with alpha wave power above the beta wave power so that the brain regions and treatments line up vertically.
- Your second question must involve comparing across handwriting, cursive, and typing.
- For example, “Is there any difference in gamma waves in the frontal lobe across the modes of handwriting, cursive, or typing for the notetaking strategy?”
- Come up with two additional questions to address with this dataset. This is a large dataset, we will demonstrate some ways you can manipulate the data by subsetting the larger table to make comparisons easier. We encourage you to explore many aspects of your data to find interesting patterns before deciding on which comparisons to present in your final report.
- One of your questions must include comparisons between alpha and beta waves in both brain regions during eyes closed and eyes open.
Food for thought
How does the human anatomy make it difficult to record and electroencephalogram or EEG?
What are common causes of the artifacts you recorded in Exercise 1? Name at least 3.
In exercise 2, under what conditions did you see alpha waves more clearly? What are alpha waves thought to indicate?
Where do you think motor activity would appear in your data?
Look at your Spectral Analysis from when the volunteer had their eyes shut. At what range do you have the greatest peak? What type of brain waves does the Spectral Analysis suggest is active? Compare this with the same for the eyes open treatment.
What is the purpose of taking a control measurement with hand movement only?
Which activities were easier or more difficult for the subject to perform? Which types of waves are more abundant during more difficult activities?
After Lab:
- This will be a group lab report.
- Please divide the work of writing the report by experiment, so that each person benefits from the experience of writing the intro, methods, results, and discussion. This will also ensure that the ideas are better connected between sections.
- Please think about effective figures for this interesting lab, and the results will jump out at you. It will also be easier to write the discussion. In the discussion circle back to the hypothesis and really try to interpret your results in light of physiological mechanisms.
- In the discussion end by synthesizing what you learned. Try to bring together aspects of the separate experiments to reflect back on what you learned. What did you learn about the processing of different notetaking strategies or scribing modalities, and anything else you may have tested?
- Please remember to include respective contributions.