Lab 8: Human Electromyography (EMG)
Acknowledgements
Material for this lab was borrowed and adopted from
- Electromyography Protocol. Written by Staff of ADInstruments for LabChart 8.
- Watch the Muscle [podcast].
- Read the lab manual below.
- Read from Eckert ch. 10 [readings]: Mechanics of Muscle Contraction 375-379, Active State, Twitch and Tetanus 391- 392, Motor Control vertebrate 410 - 411
- Write the [Prelab] in your lab notebook. Please DO NOT copy the lab manual word for word. Your task is to summarize the important points for this experiment.
- This week, draft hypotheses for each experiment, then outline the structure of the introdution for your future lab report. Your outline of paragraphs for the introduction should come together like this:
- Umbrella idea
- introduce mechanism 1
- introduce mechanism 2
- …
- end with a paragraph of your hypotheses
- For the prelab please have the hypotheses, figuring out how many ideas you have to cover, and writing a topic sentence for each paragraph.
- For the methods, outline:
- subjects
- equiptment
- experimental treatments (be sure to note what variables are changing) and controls or comparisons
- analysis
- Do Quiz on Laulima (open 24 hrs before lab).
- Please bring a laptop with you to lab, if possible, to analyze your experimental results.
- We will explore the electrical activity of skeletal muscle in relation to the generation of force and movement. In this experiment you will record electromyograms in human subjects during voluntary muscle action. We will explore various properties of motor control and the activity of opposing muscle groups.
Background
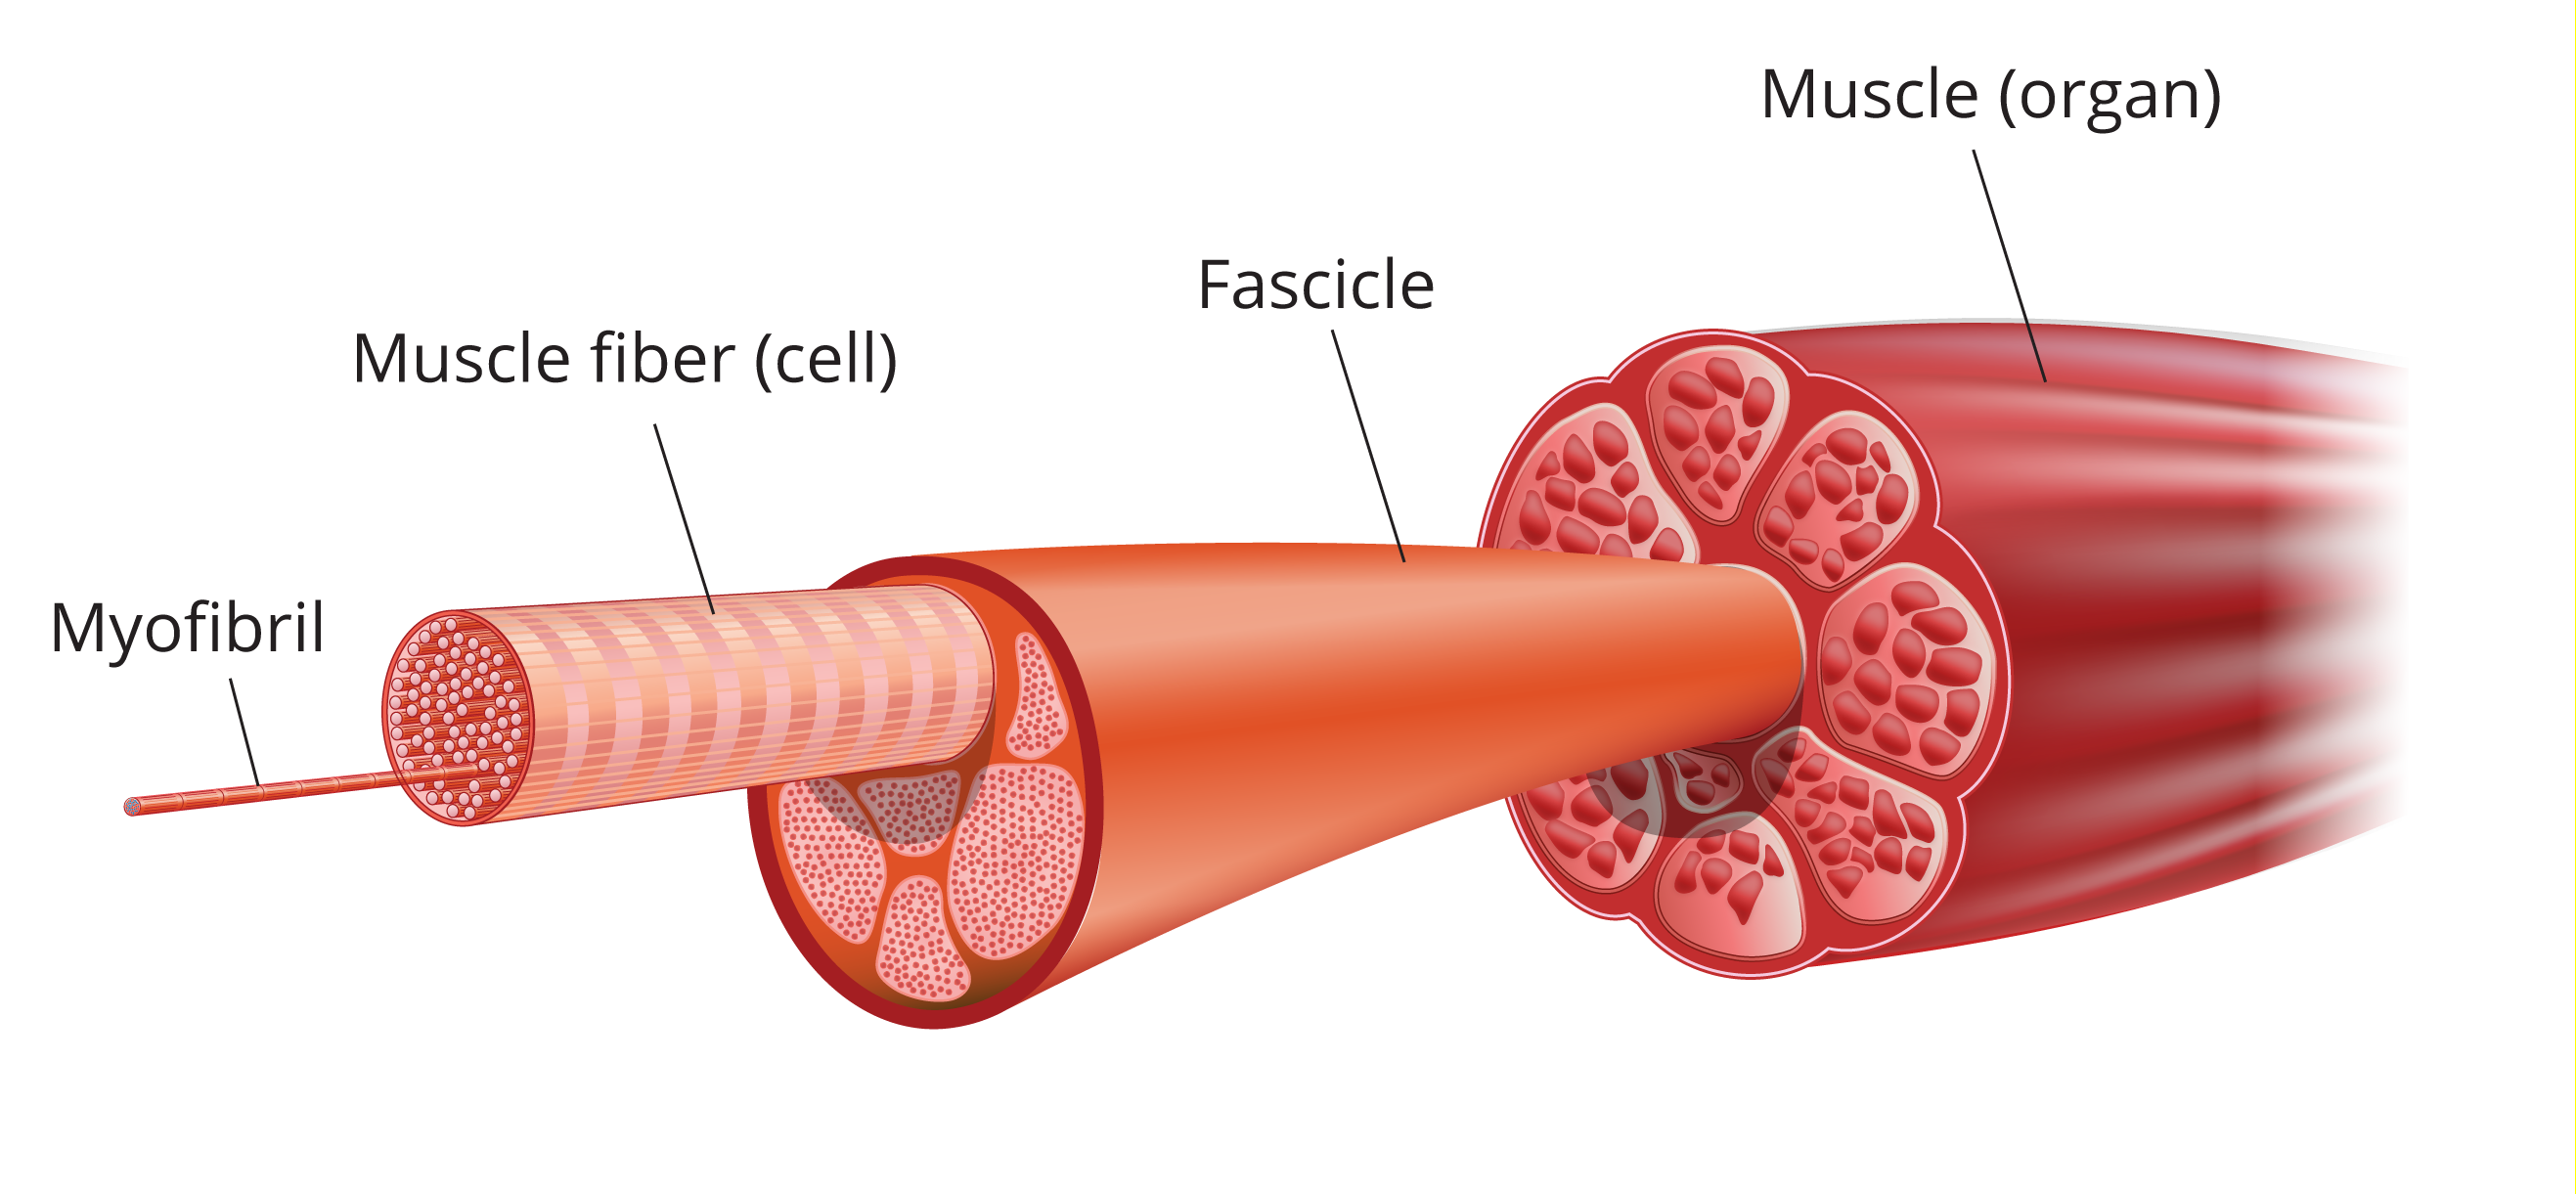
Skeletal muscles do the majority of the work for locomotion and support of the animal skeleton. Some of the functions that skeletal muscles perform include: producing movement, stiffening the body to maintain posture, and generating heat, among others. Skeletal (striated) muscles attach to the skeleton by tendons (strong bundles of collagen fibers), aponeuroses (flat, sheet like tendons) and fascia (bands of connective tissue), and can cross joints. Muscles have a heirarchichal structure where each muscle (the organ level) is made up of individual muscle fibers organized in fascicles (Figure 1). A typical skeletal muscle in a human contains thousands of muscle fibers.
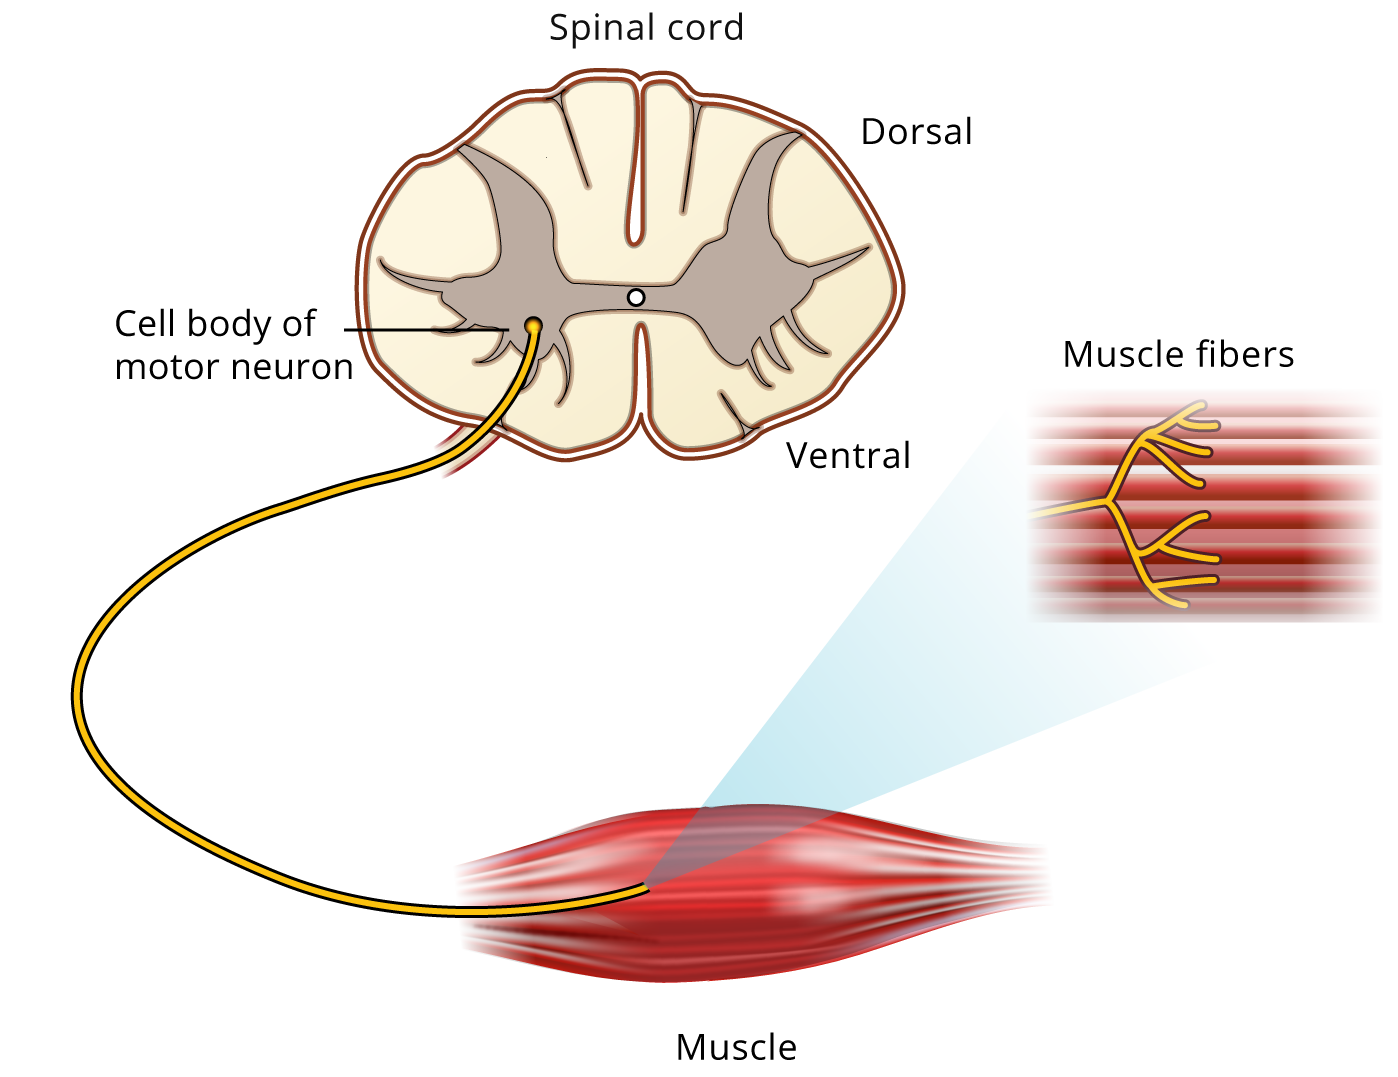
Voluntary movements are controlled by instuctions from the central nervous system. Each skeletal muscle fiber is innervated by a branch of a motor axon or neuron. Each motor neuron innervates many muscle fibers. The motor neuron and all of the fibers it innervates is called a “motor unit” (Figure 2). All of the motor neurons that innervate a single muscle is called a “motor pool”.
When an action potential travels down a motor neuron, the action potential typically activates all of the muscle fibers it innervates, resulting in contraction of all the muscle fibers in the motor unit. This activation process involves (1) the initiation of an action potential, either voluntarily or as a result of electrical stimulation of a peripheral nerve, (2) conduction of the action potential along the nerve fiber, (3) release of neurotransmitter at the neuromuscular junction, and (4) depolarization of the muscle membrane with resultant contraction of the muscle fibers.
During a contraction, therefore, there is synchronous activity in a number of fibers in the same muscle. The electrical signal from a contracting muscle can be recorded using skin surface electrodes. This recording of muscle activity is called an electromyogram or EMG. The raw surface EMG signal reflects the electrical activity of the underlying muscle fibers active at that time. Motor units fire asynchronously and result in what often looks like a chaotic signal.
The raw EMG signal during voluntary contractions may be processed in various ways to indicate the intensity of EMG activity. In the method we will used here, known as the root mean square (RMS), the EMG signal is squared, averaged, and the square root calculated. This is what is called a geometric mean, and has the effect of counting both the negative and positive deflections of the signal, as well as smoothing out individual spikes, so that the change in muscle activity over time is much clearer.
Activation or “recruitment” of greater numbers of motor units result in greater numbers of fibers contracting, producing a greater density of action potentials (and may represent the electrical activity of perhaps thousands of fibers). With greater recruitment, we also see greater muscle force.
Another way to increase force output is to increase the frequency of firing. A single muscle contraction is transitory and called a “twitch” but a train of action potentials will result in a fused “tetanus” and sustained contraction. In either case, the EMG activity is not a regular series of waves like the ECG, but a chaotic burst of overlapping spike-like signals. Why do you think this is the case?
In this experiment, you will record EMG activity during voluntary contractions of skeletal muscle groups, focusing on the biceps and triceps muscles of the arm, which are antagonistic muscles that control movement at the elbow.
What you will do in the laboratory
- Setup. Check that the equiptment are set up correctly and ready to record.
- Muscle activation with increasing load. You will increase the load on the muscle-joint system, and measure changes in electrical activation of the biceps.
- Alternating activity and coactivation. You will explore the function of antagonistic muscles and demonstrate coactivation.
- Several of your own experiments. See below for ideas.
Equipment
- PowerLab data acquisition system
- LabChart 8 or later
- 5 Lead Shielded Bio Amp Cable
- Shielded Lead Wires (5 Snap-on)
- Dry Earth Strap
- (optional) Stimulating Bar Electrode
- Electrode Cream or Paste
- Abrasive Gel or Pad
- Alcohol Swabs
- Gauze or cotton ball (or similar material)
- Ballpoint pen
- Scissors
- Four books or objects of similar weight (about 1 kg/2.2 lbs each)
Procedure
Subject preparation
- Make sure the PowerLab is turned off and the USB cable is connected to the computer.
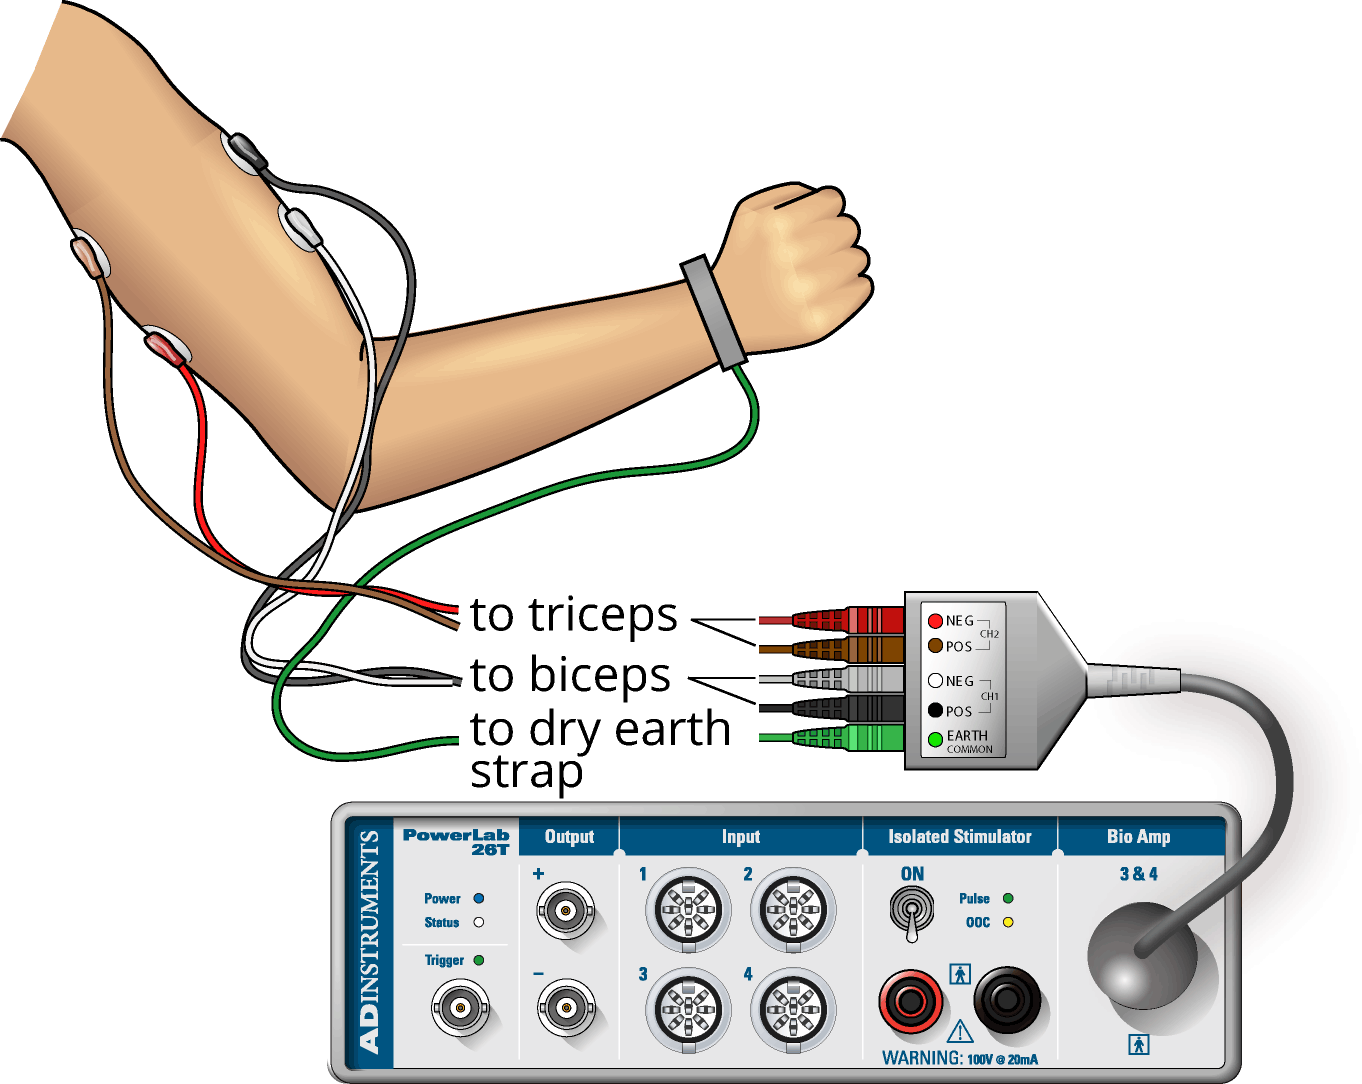
- Connect the 5 Lead Shielded Bio Amp Cable to the Bio Amp Connector on the front panel of the PowerLab (Figure 3). The hardware needs to be connected before you open the settings file.
- Have the subject remove all jewelry or metal objects in contact with their skin. Visually inspect all of the cup electrodes and make sure that the cups are clean and bare for a good electrical signal. If necessary, clean them gently (they are fragile) - ask your TA for help.
- Plug the lead of the dry earth strap into the Earth connection of the Bio Amp cable. Firmly attach the dry earth strap (electrode) around the palm or wrist of the volunteer. Ensure that the fuzzy side of the dry earth strap is in full contact with the skin.
- Gently abrade the skin or swab with alcohol to make good electrical contact with the electrodes (Figure 3).
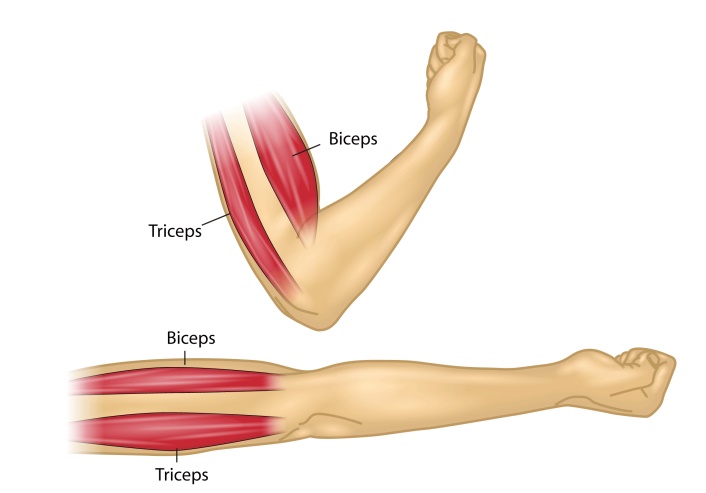
- With a ballpoint pen, mark two small crosses where the electrodes will be placed on the biceps muscle (Figure 4). The crosses should be 2–3 cm apart and aligned with the long axis of the arm (along the length of the muscle). Do the same for the triceps muscle.
- Fill each disk electrode with electrode cream. Place the electrodes onto the skin over the crosses, and fasten them firmly in place with masking tape.
- Plug the leads of the EMG recording electrodes into the Bio Amp cable, as shown in (Figure 3). Polarity doesn’t matter for EMG, but do make sure that the two leads (+ & -) for each channel are attached to the same muscle, and the biceps recording on channel 1, and triceps recording on channel 2. Check that all electrodes are properly connected before proceeding.
Starting the software
- Start Chart using the EMG lab settings file. Four channels should appear: the raw EMG signal and the RMS activity (a summation and smoothing of the raw EMG) for each of the mucles, the biceps and triceps.
- Make sure that the raw EMG channel is set to the “Bioamp”, and that the computed input (summation of the EMG) is reading the channel for the raw EMG channel. To do this, under the “Setup” menu choose “setup channels” and check that the input is “Bioamp” (and not “Input Amplifier”). You may have to change the inputs to match the correct channel number. If you are using the new setup, you may have to change and restart Chart (several times) with the Bioamp cable connected for it to appear in the menu. If you are using the old setup, the little green light on the front of the Bioamp should be on. In either case, the channel setup window should indicate “Bioamp”. Ask your TA for help if needed.
Exercise 1: Activation with increasing demand
We will explore voluntary muscle contractions with increasing demand, and how activation of motor neurons changes to meet demand. (Think about what is happening in terms of muscle physiology).
- The volunteer should sit in a relaxed position, with elbow bent to 90° with the palm facing upwards. He or she should use the other hand to grasp the wrist of the recorded arm.
- Choose the Bio Amplifier… command from the raw EMG Channel pop-up menu and make sure the range is set to 2mV, High Pass to 10Hz, and Low Pass to 200Hz.
- Ask the volunteer to make a strong contraction of their muscle. For biceps muscle, a strong contraction can be generated by trying to bend the recorded arm further and resisting this movement with his or her other arm. (For triceps muscle, a strong contraction can be produced by trying to straighten out the recorded arm and resisting this movement with his or her other arm.) Observe the signal (Figure 5) and adjust the value in the range pop-up menu so that the maximal electrical response occupies about one half to two-thirds of the full scale. Do the same range adjustment for the triceps recording channel.
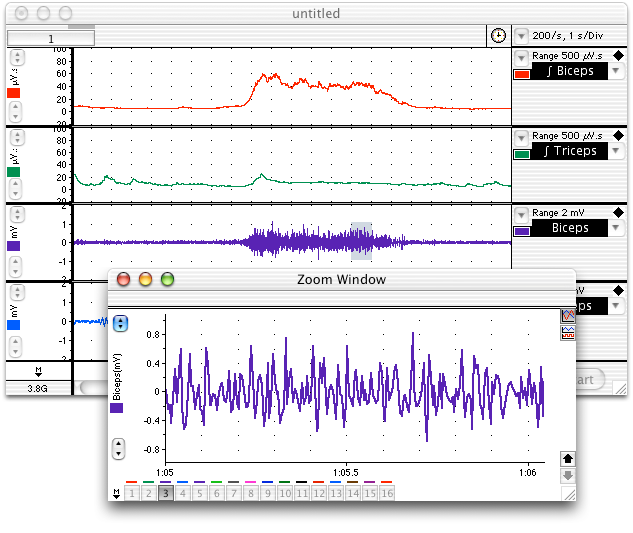
- Start recording. The volunteer should perform a maximum contraction of the biceps and then the triceps with the EMG electrodes attached. Comment on each muscle contraction. Stop recording, and check that the integrated signal traces are clearly visible in the Chart window and look something like (Figure 6). If not, use the Amplitude Axis controls in their channels to adjust the vertical scale so that they are visible.
- The volunteer should once more sit in a relaxed position, with his or her elbow unsupported and bent to 90° with the palm facing upwards.
- Resume recording. Prepare a comment “one book”. After a few seconds, place one weight (a book) on the hand of the subject and comment. Leave it on for three seconds to record the change in the EMG, then remove the weight. Repeat this process for two, then three, then four books, for a series of increasing weights. Stop recording and save your data.
Analysis: Change in contractile activity
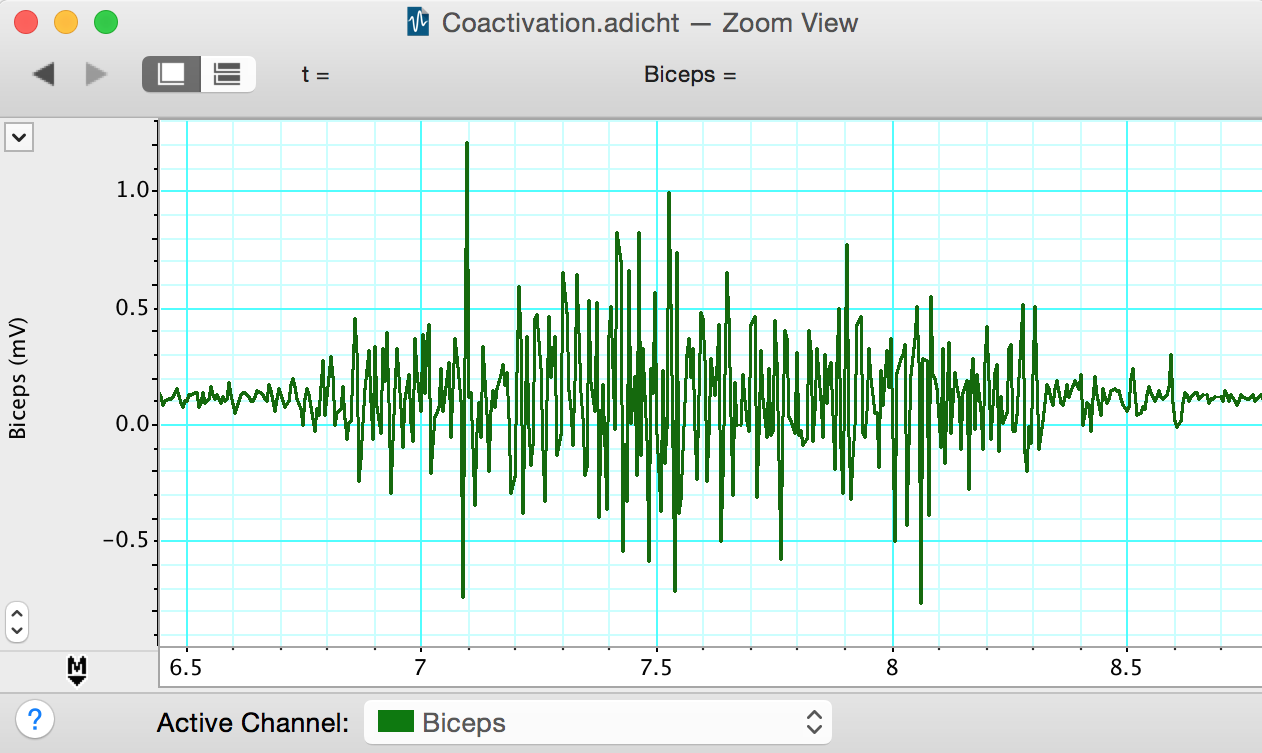
- Scroll through the recorded data and note the changes in activity in the raw biceps channel. Note also that placing weights on the hand gives rise to little or no activity in the triceps muscle. Select a small part of the “Biceps” activity and examine it in Zoom View. The raw EMG signal is composed of many up-and-down spikes (Figure 5).
- Note the relationship between the “Biceps” channel and the “RMS Biceps” channel. The height of the RMS trace reflects the overall activity of the raw EMG signal and gives a simpler view of the muscle’s electrical activity. Note the changes in the RMS trace as books were added and removed.
- Select data points from “RMS Biceps” when books were added. Enter these values in Table 1. In this experiment, the height of the trace correlates with the force produced by the muscle. (why?)
| N books | RMS biceps amplitude (mV.s) |
|---|---|
| 1 | |
| 2 | |
| 3 | |
| 4 |
Excercise 2: Alternating activity and coactivation
We will examine the activity of antagonist muscles and the phenomenon of coactivation.
- Use the following settings: sampling rate = 200 m/s, digital filter (low pass) = 100Hz. Connect the push button switch to one of the channels on the PowerLab to record the start and end of each muscle flexion.
- The volunteer should sit in a relaxed position, with his or her elbow bent to 90° with the palm facing upwards. He or she should use the other hand to grasp the wrist of the recorded arm.
- Ask the volunteer to activate the biceps and triceps alternately. The biceps muscle can be activated by trying to bend the recorded arm further and resisting this movement with the other arm. The triceps muscle can be activated by trying to straighten out the recorded arm and resisting this movement with the other arm. The volunteer should practice this alternating pattern until it feels like both muscles are being equally activated in turn. Pause breifly after each activation; this makes the data cleaner for analysis.
- Begin recording. Record a baseline for 30sec.
- Add a comment “activation”, and have the volunteer use the alternating patttern of activation for 30 sec. Have the volunteer call out which muscle and comment at each activation. Stop recording and save the data file.
Analysis: Alternating activity and coactivation
- Scroll through the recorded data and observe the EMG traces for both the biceps and triceps. Note the large-scale alternation of activity in the biceps and triceps relative to the marker at the start of each muscle contraction.
- Note also that when the biceps muscle is activated forcefully, there is a minor increase of activity in the triceps. Correspondingly, there is a minor increase of activity in the biceps trace when the triceps is activated. This phenomenon is called ‘coactivation’. How might this stabilize the elbow joint?
- Collect data from the RMS EMG peaks for each muscle during contracton of the biceps and triceps (Table 2).
| Muscle contracting | RMS biceps amplitude (mV.s) |
|---|---|
| biceps | |
| triceps |
Additional Exercises
Below is a list of additional exercises to do. Pick several of these (at least 3) and develop appropriate experimental approaches to understanding how muscle EMGs vary as a result of each of these factors.
- Isometric vs. isotonic contraction (no change in muscle length vs. no change in muscle force [approximately])
- EMG during exercise of a muscle group to exhaustion (and after recovery)
- EMGs from different volunteers with different muscle mass or build (donʻt forget to take some measurement of the muscle differences for the comparison)
- EMGs during muscle contraction of different speeds (e.g. lifting book slowly vs quickly)
- Your own exercise
Food For Thought
- Unlike the discrete waveform from an electrocardiogram, the electromyogram waveform is irregular. Why do you suppose that is?
- How did the EMG trace change when you added weights (increased load)? What do your results indicate? Would this be an example of isometric or isotonic contraction?
- What is coactivation? Why do you think this phenomenon occurs?
- What happened to the triceps EMG trace when the biceps was activated? Does the data support the phenomenon of coactivation?
- What do you expect to see during isotonic vs. isometric contraction? How do your data illustrate these major results in muscle physiology. Why do you suppose these patterns exist?
After Lab:
- This will be a group lab report.
- Please divide the work of writing the report by experiment, so that each person benefits from the experience of writing the intro, methods, results, and discussion. This will also ensure that the ideas are better connected between sections.
- Please think about effective figures for this interesting lab, and the results will jump out at you. It will also be easier to write the discussion. In the discussion circle back to the hypothesis and really try to interpret your results in light of muscle physiology mechanisms.
- Please remember to include respective contributions.