Lectures
Introduction to OU Models
module 8
week 15
comparative analysis
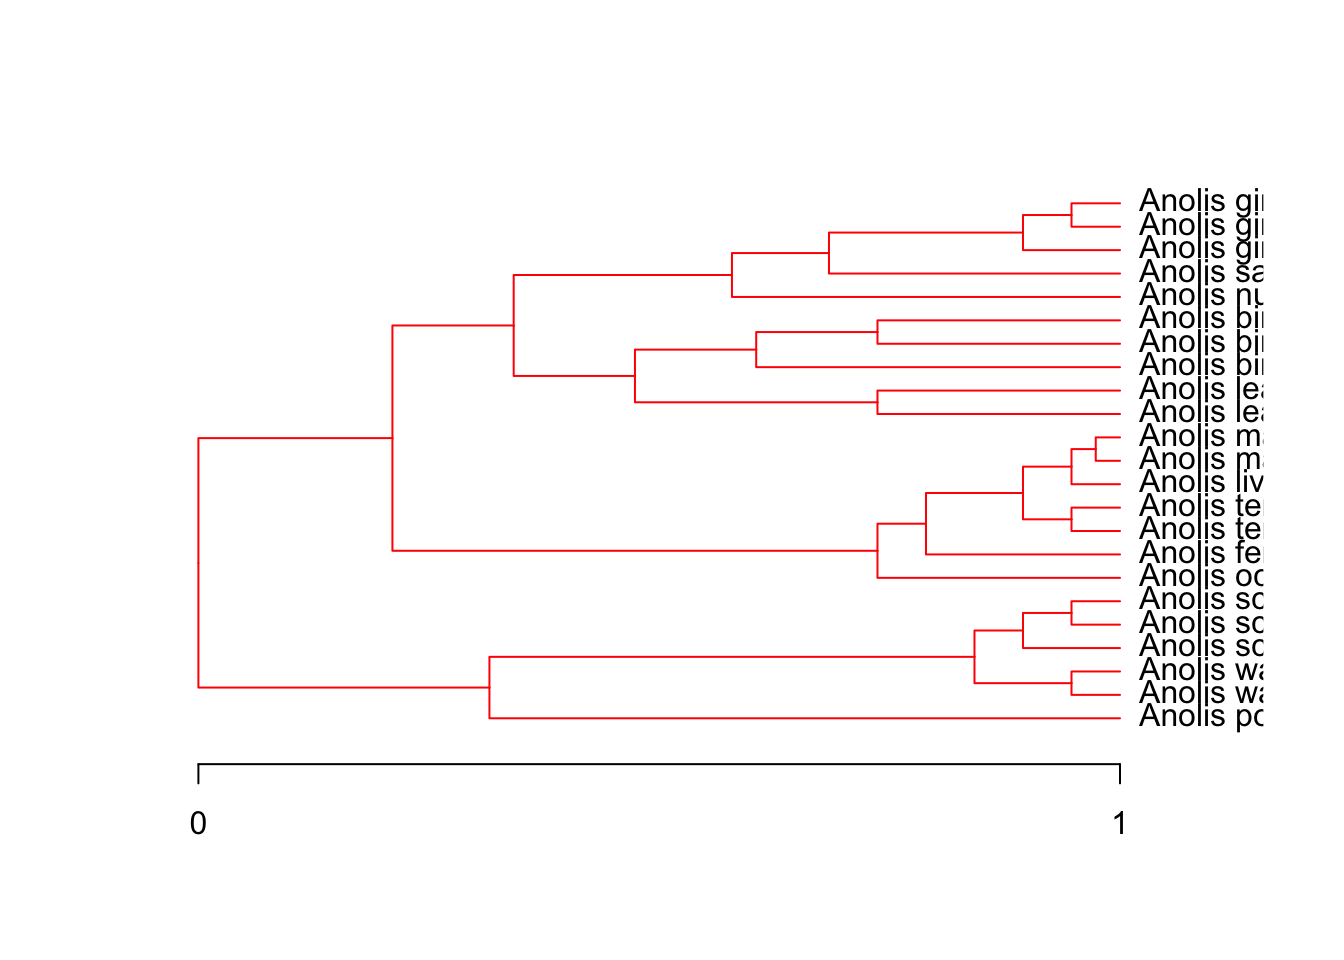
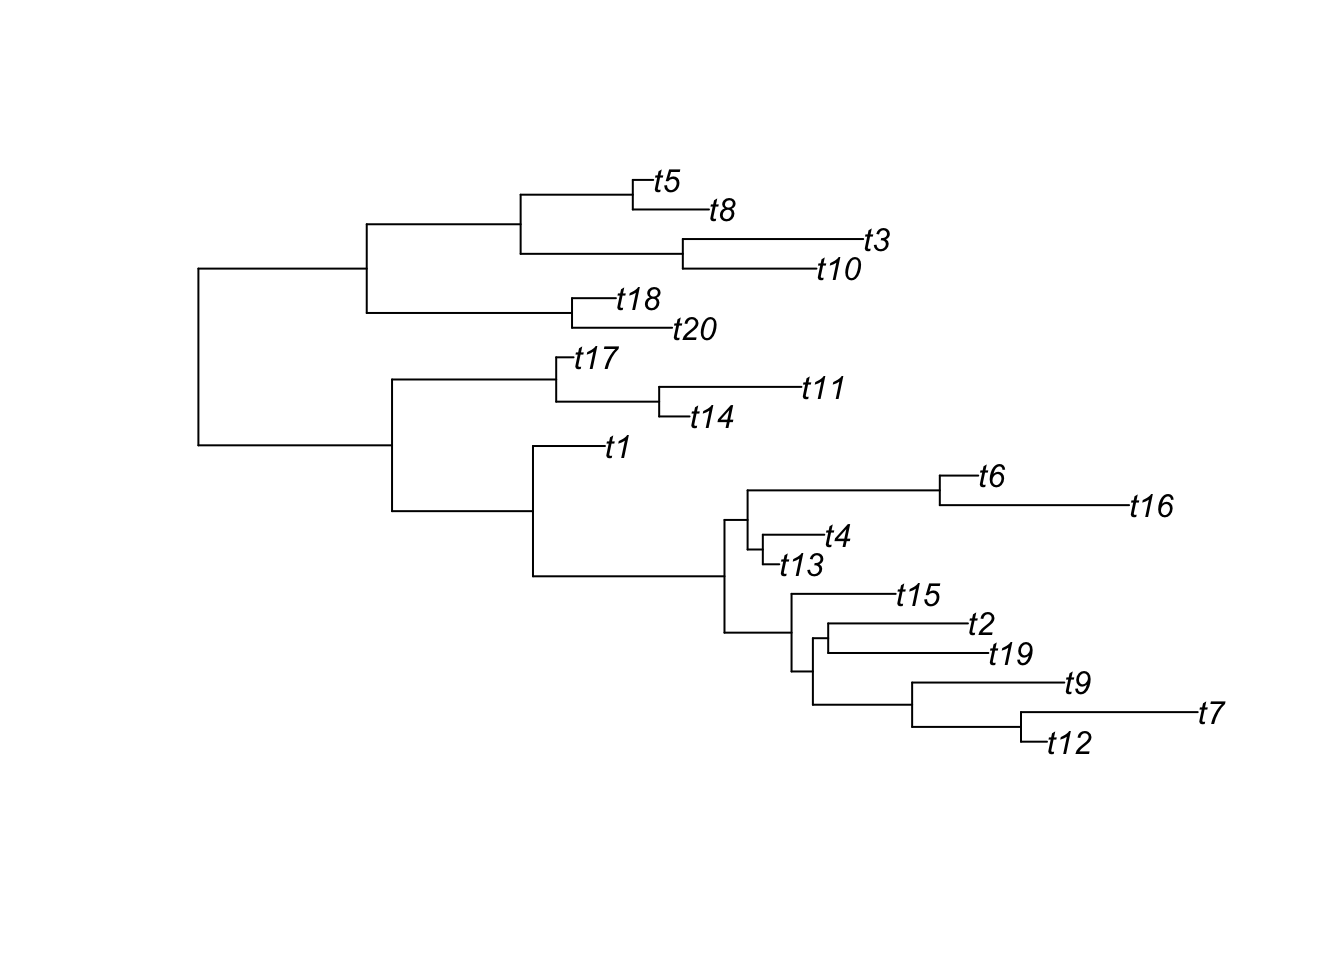
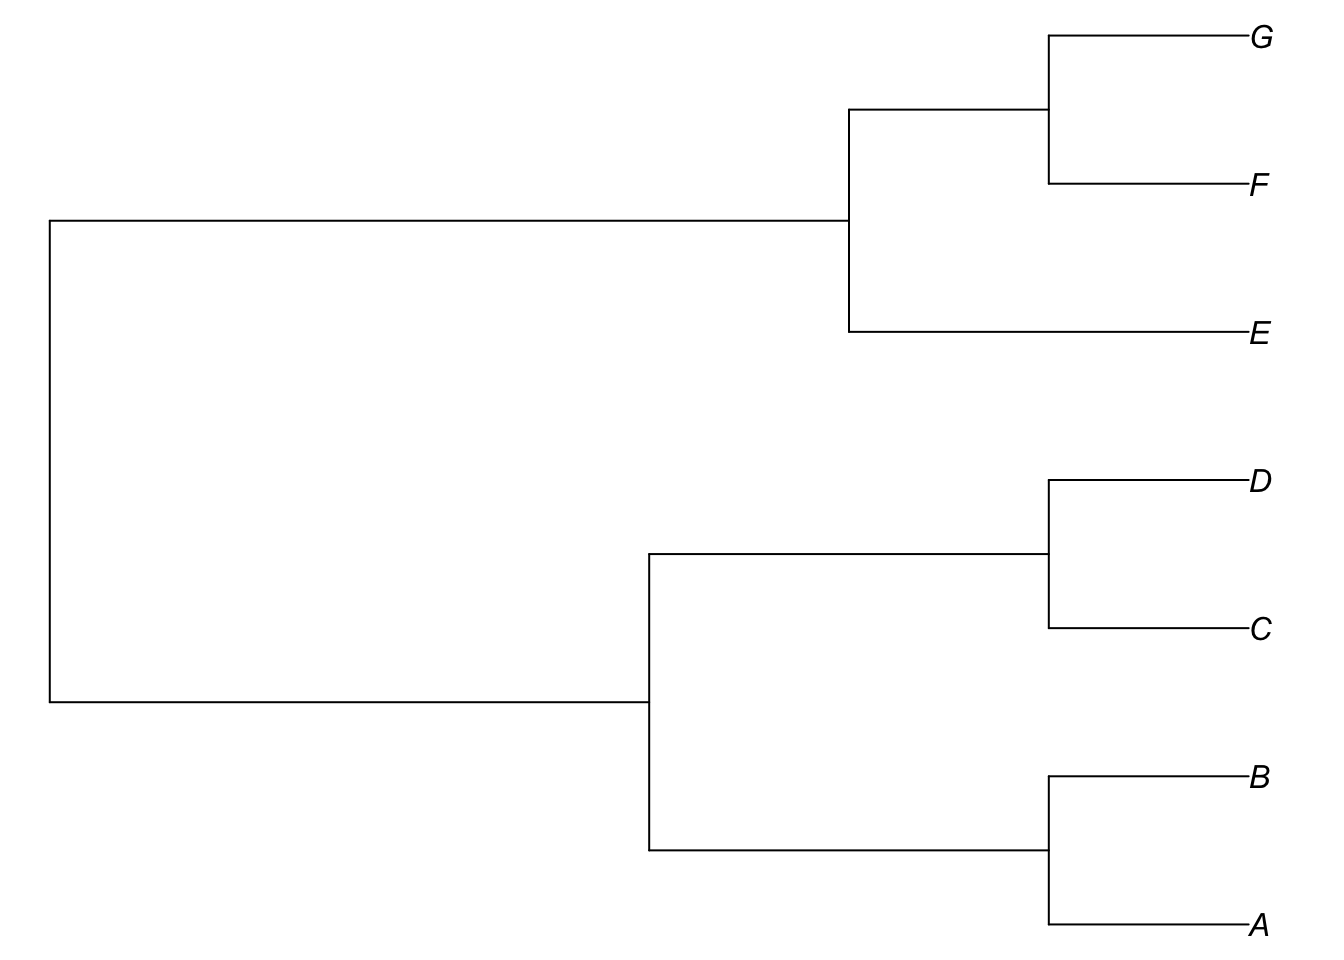
phylogenetic trees
Ornstein Uhlenbeck
Brownian motion
Phylogenetic Inference with IQTREE2
module 7
week 13
iqtree2
phylogenetic inference
command line
gene concordance
site concordance
gene tree
species tree
Setting Up for IQTREE2
module 7
week 13
iqtree2
phylogenetic inference
command line
The ggtree-verse
module 7
week 13
phylogenetic trees
phylo
ggtree
treedata
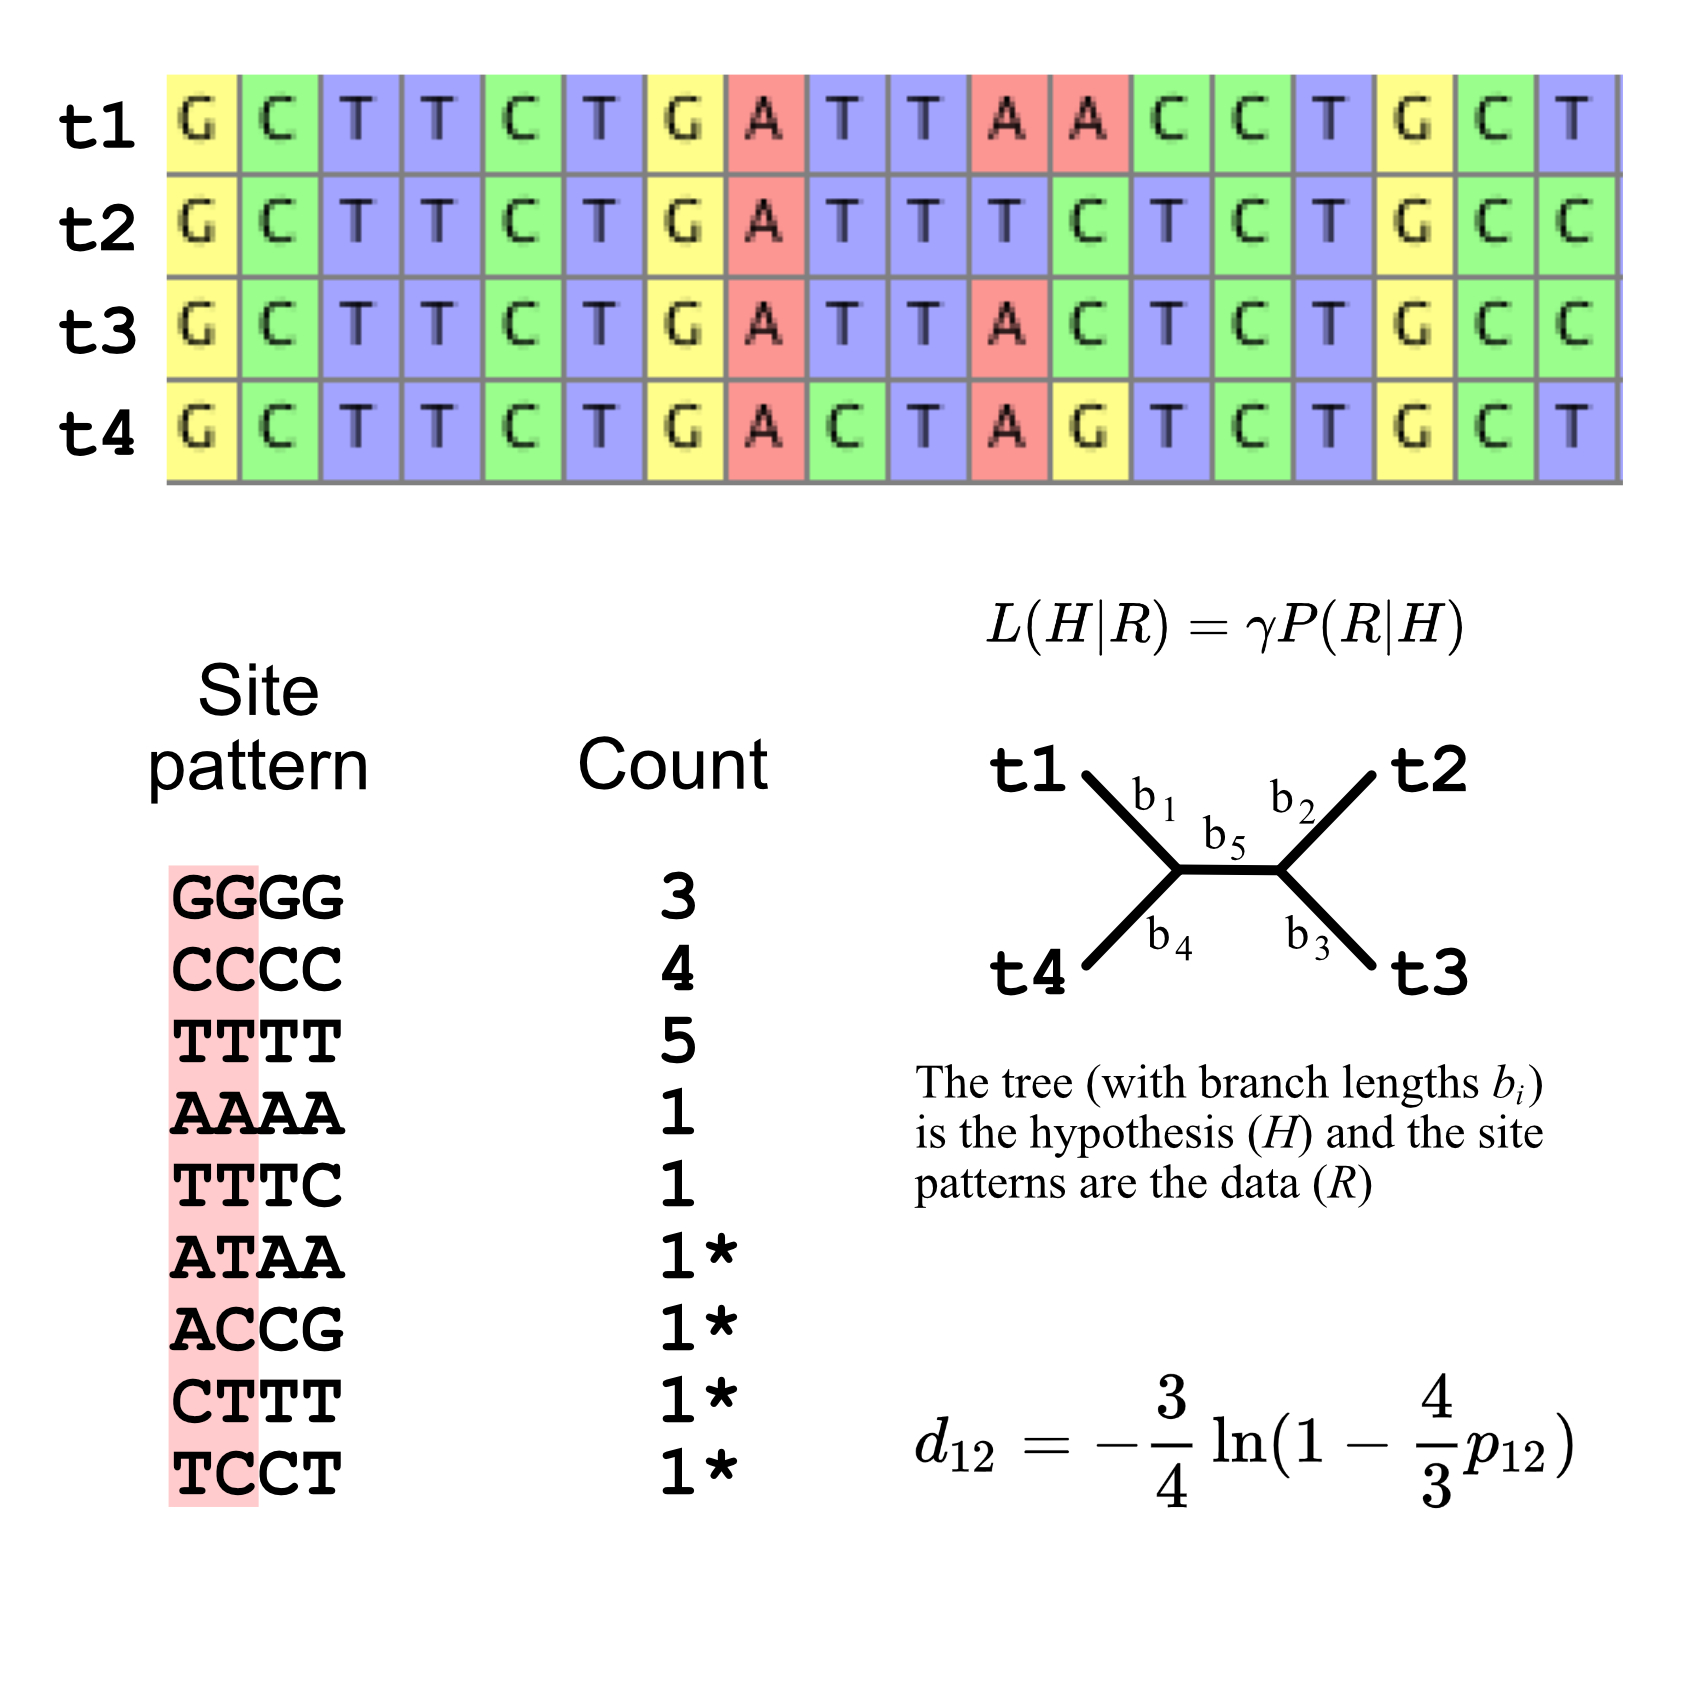
All about trees
module 7
week 13
phylogenetic trees
nexus
fasta
newick
beast
iqtree
Vectorization with Apply Functions
module 5
week 10
apply
lists
for loops
programming
Program Flow
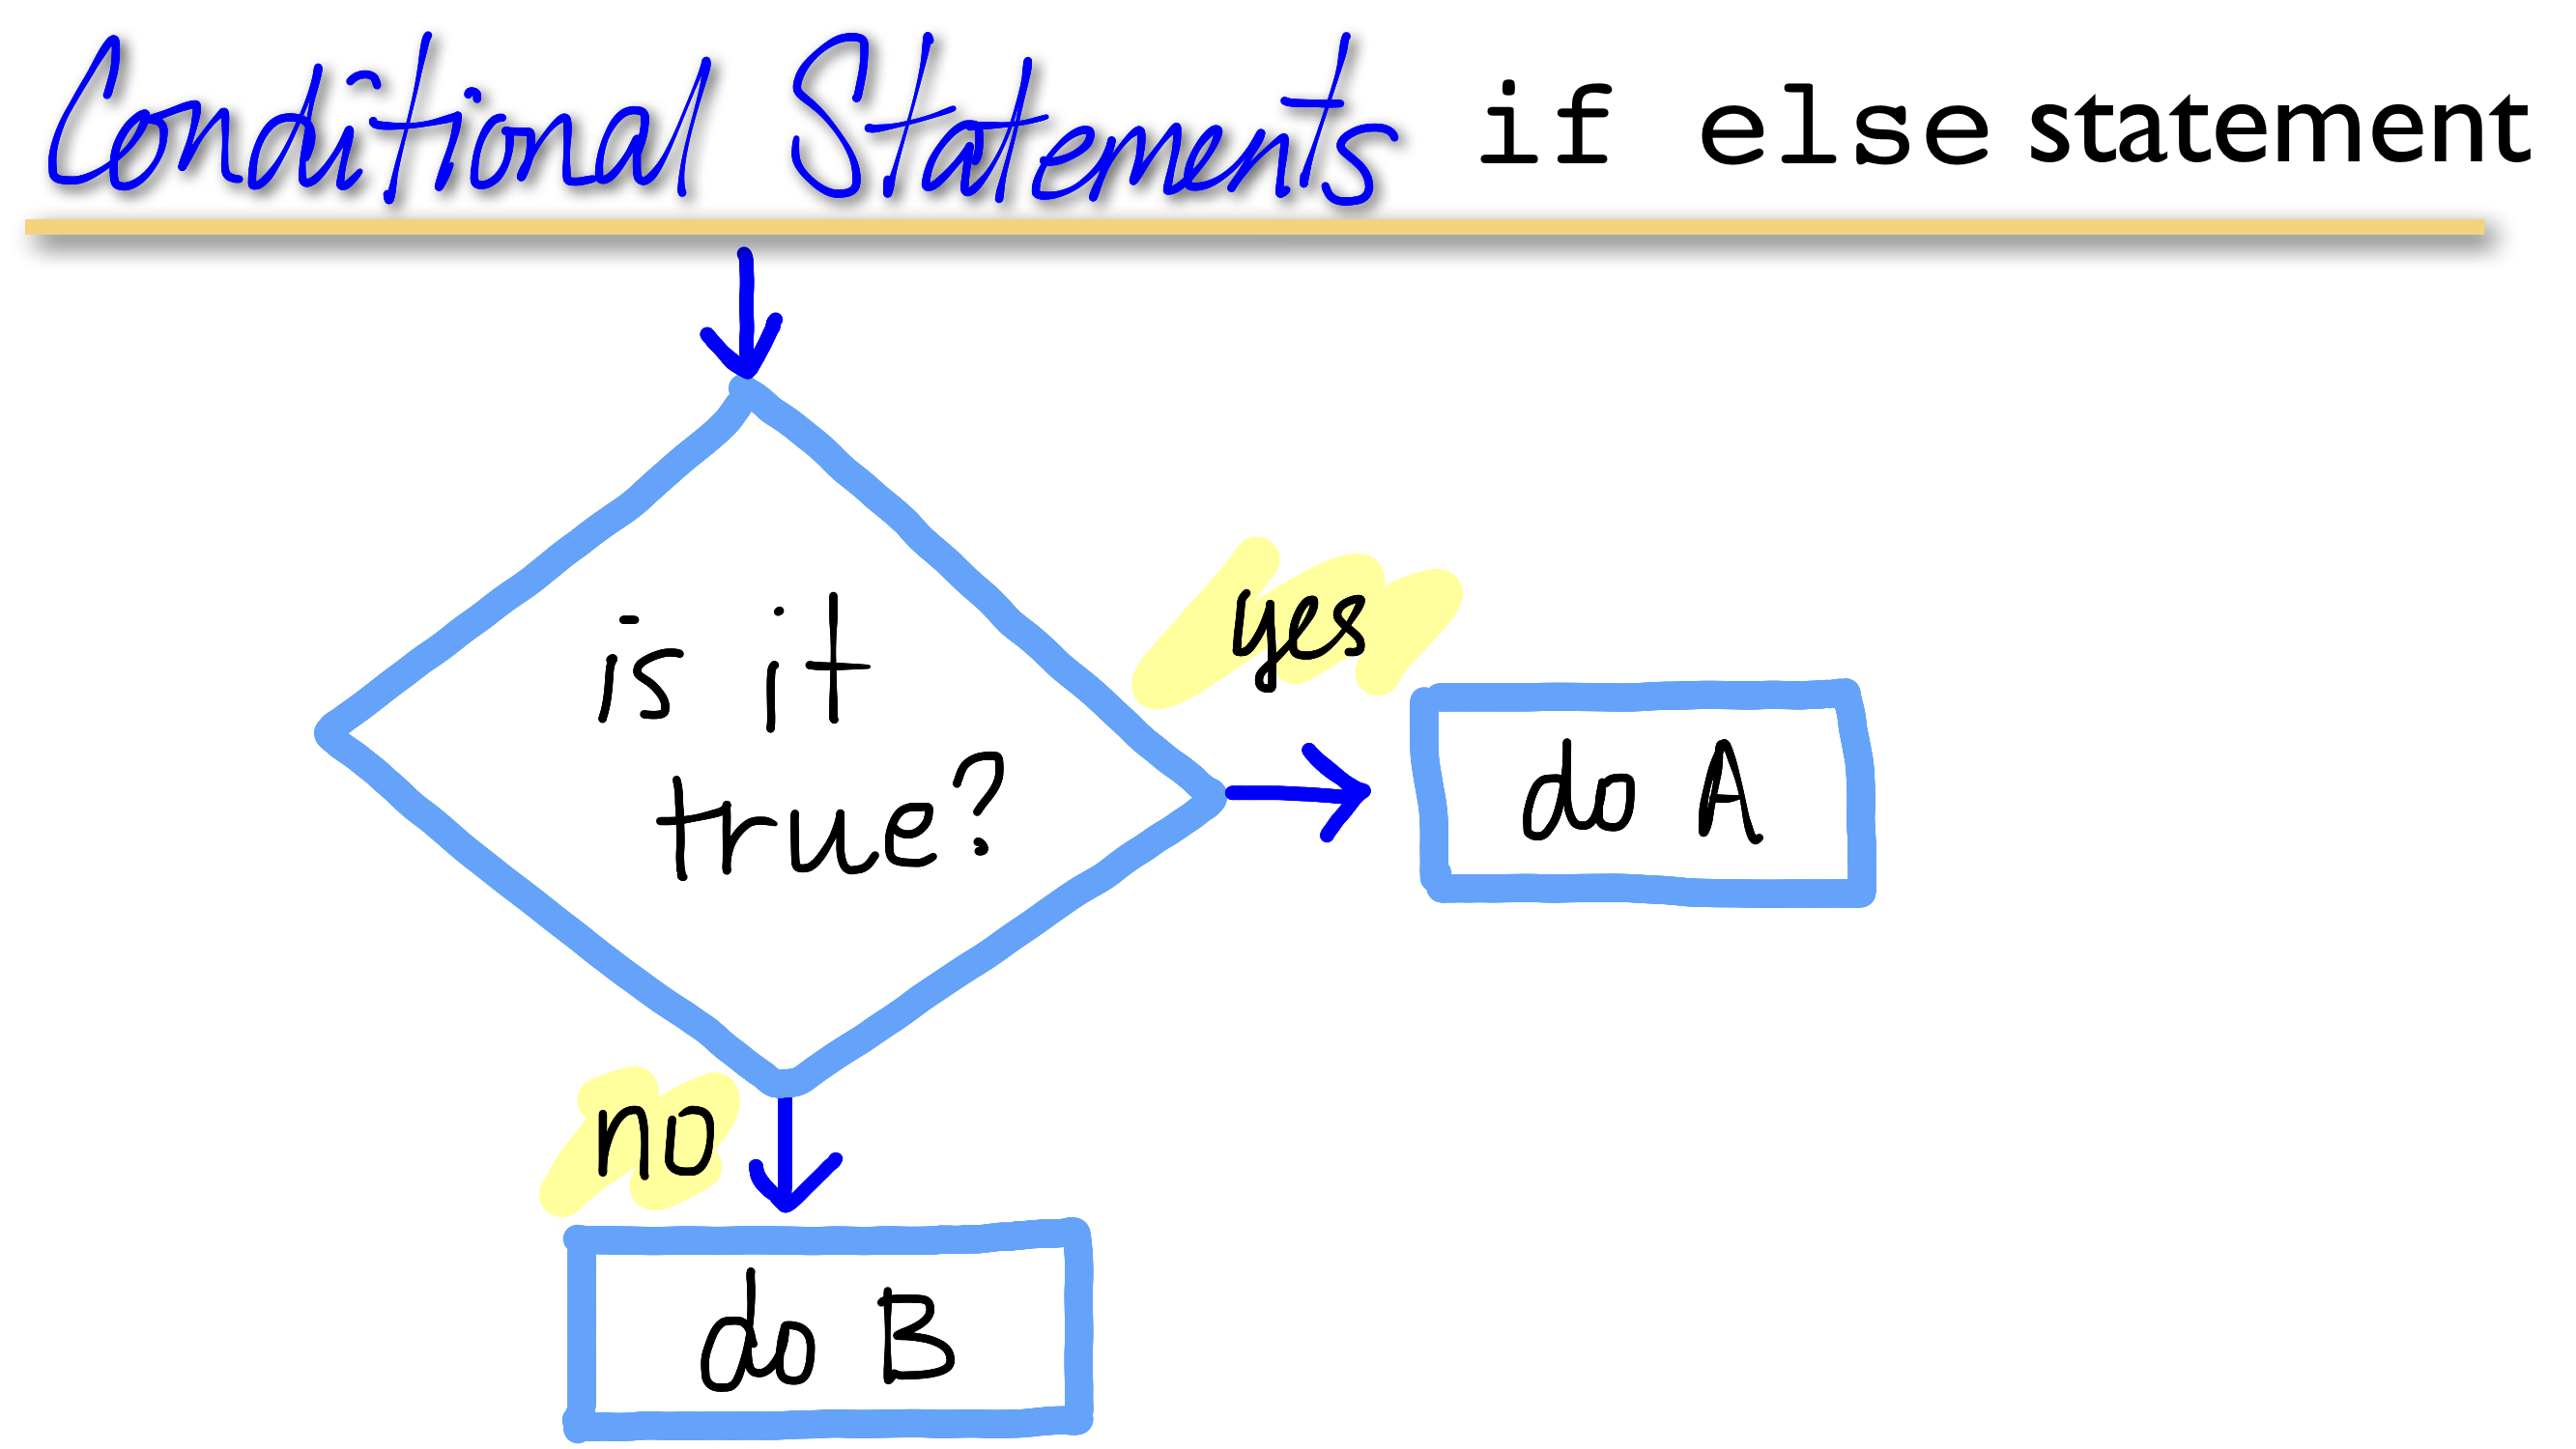
module 5
week 11
control structures
if else
(do) while
programming
Lists and For-Loops
module 5
week 10
lists
for loops
programming
Reshaping data with dplyr
module 4
week 8
tidyr
tidyverse
dplyr
tibble
Writing your own functions
module 4
week 8
programming
functions
methods
scope
Joining data with dplyr
module 3
week 7
tidyr
tidyverse
dplyr
tibble
pipe
A small tour of multivariate analysis
module 4
week 8
multivariate
statistics
R
A small review of univariate parametric statistics
module 4
week 7
univariate
statistics
ggplot2
dplyr

The ggplot2 package
module 3
week 7
R
programming
plotting
ggplot2
data visualization
Plotting Systems
module 3
week 5
plotting
ggplot2
lattice
data visualization

Tidying and Exploring Data
module 2
week 5
data
data structures
objects

Types of Data
module 2
week 4
data
data structures
objects
Saving your work as R scripts
module 1
week 4
R
scripts
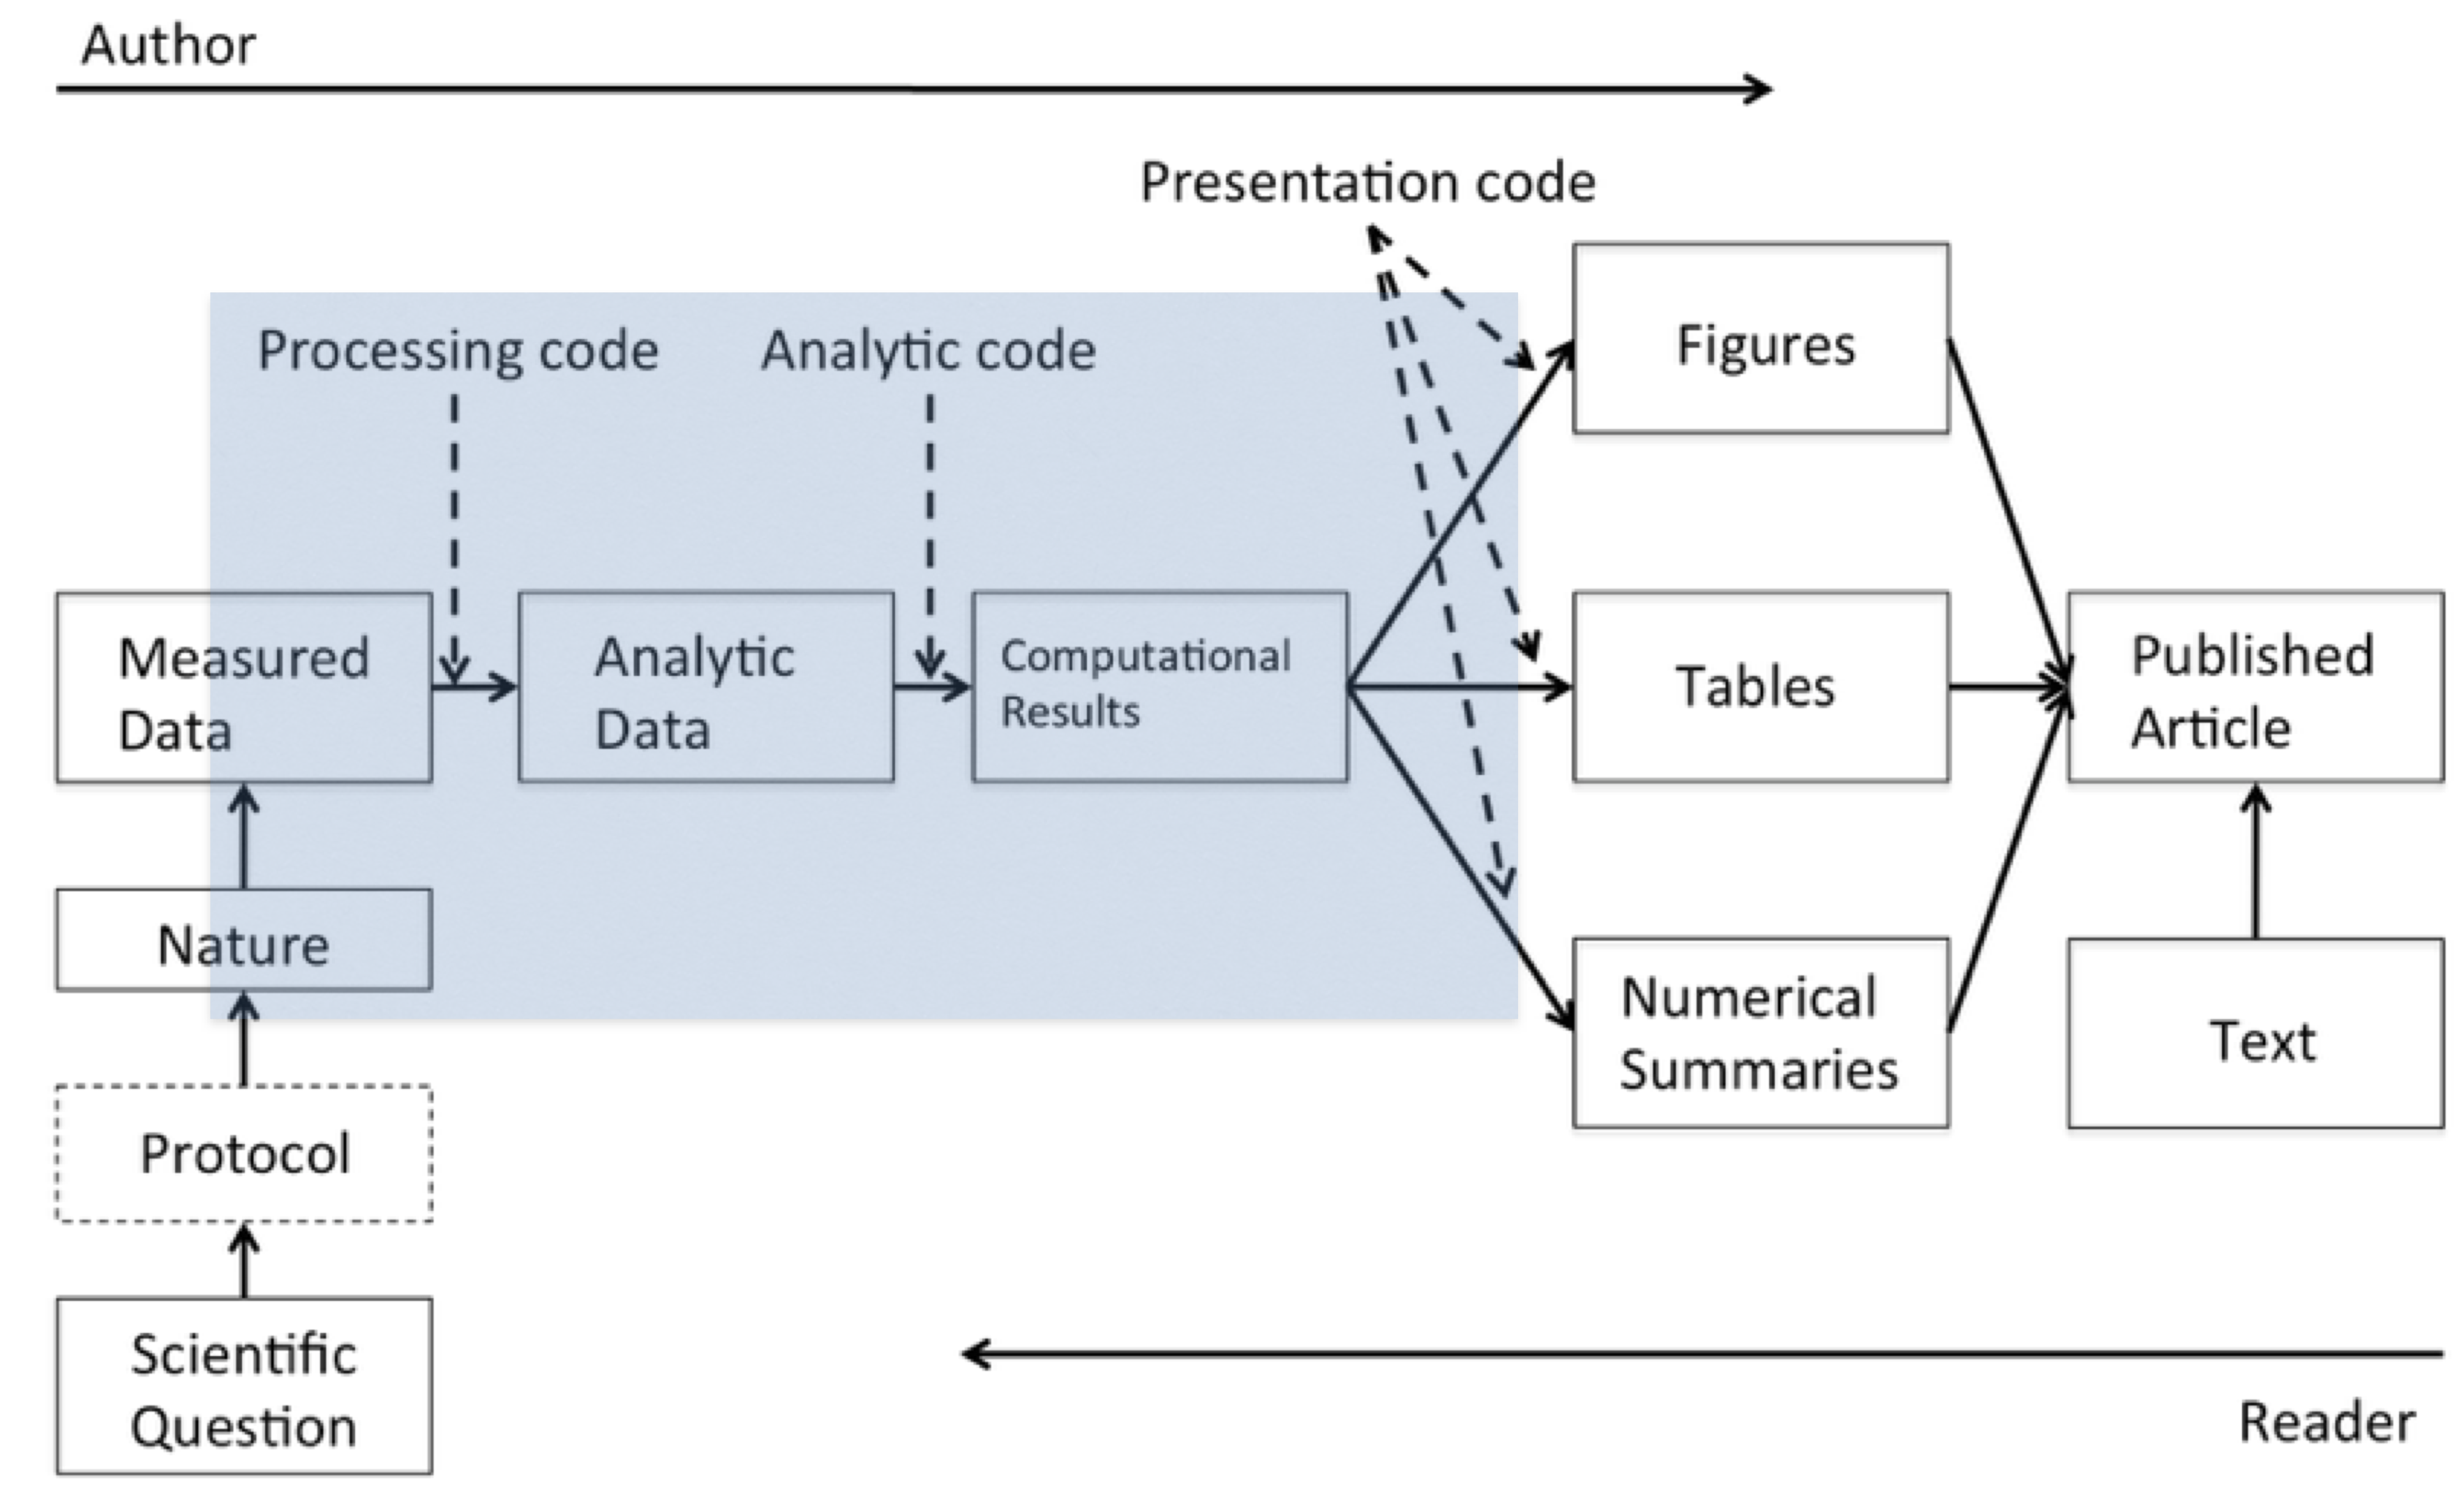
reproducibility
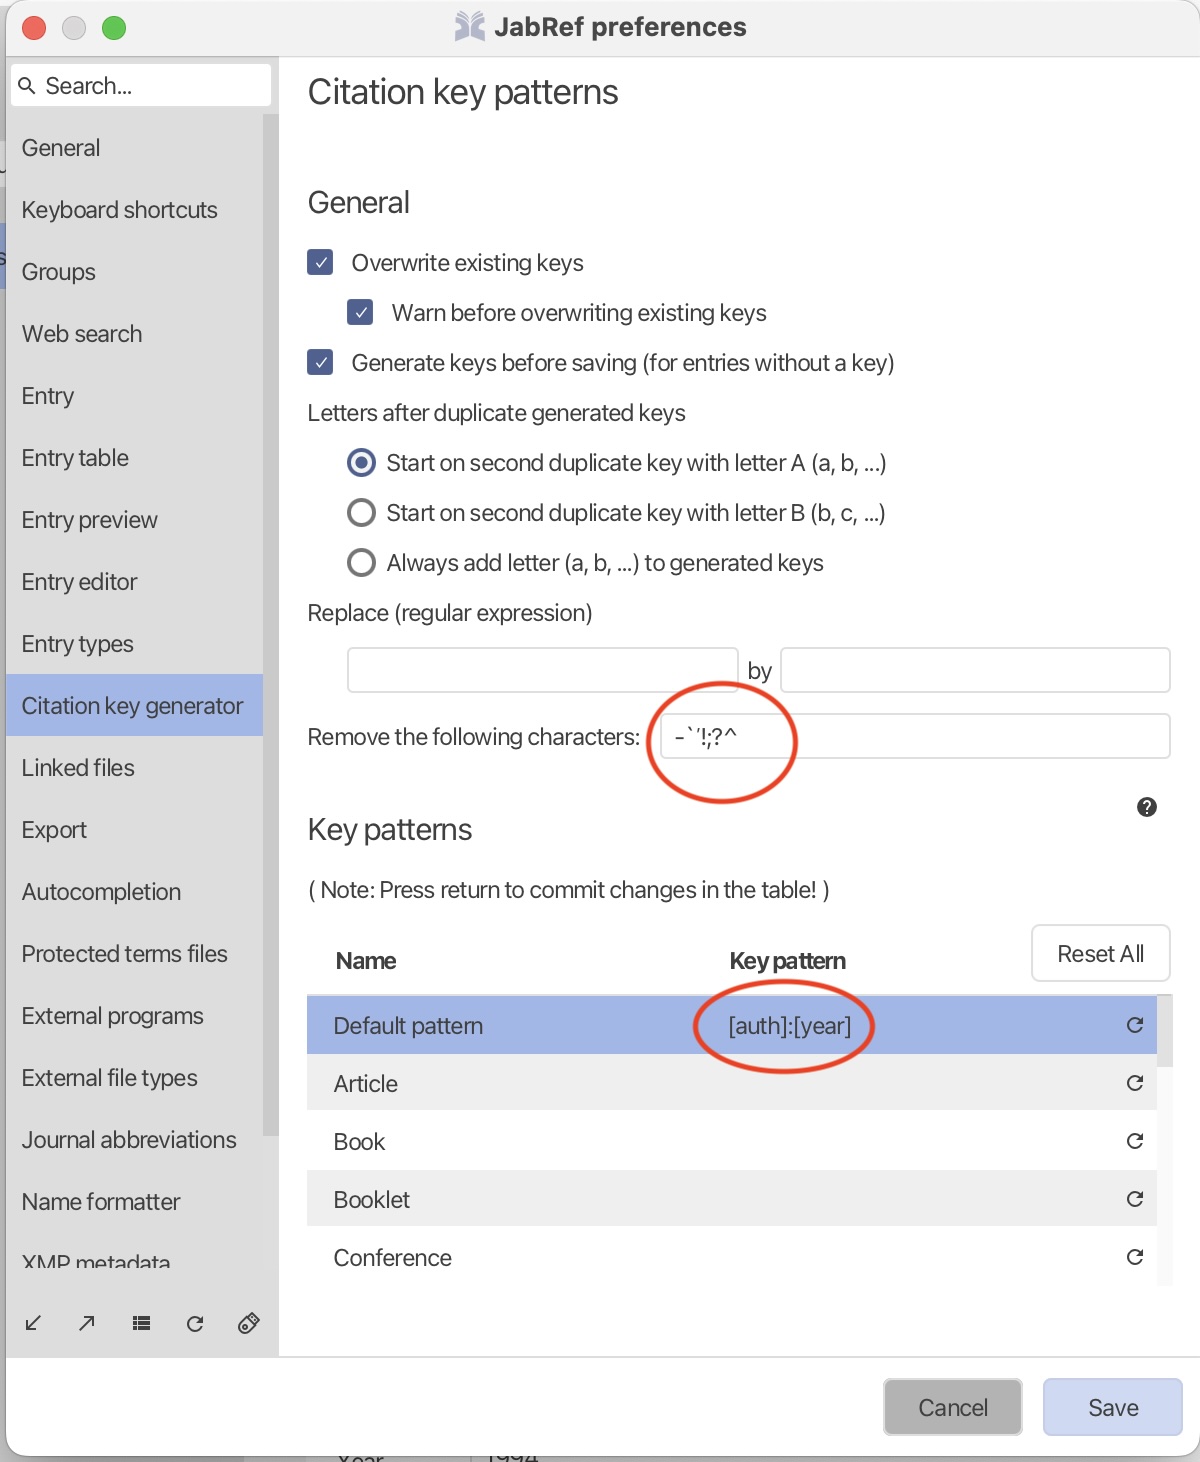
Reference management
module 1
week 3
Quarto
authoring
BibTeX
programming
Literate Statistical Programming and Quarto
module 1
week 2
Markdown
Quarto
programming
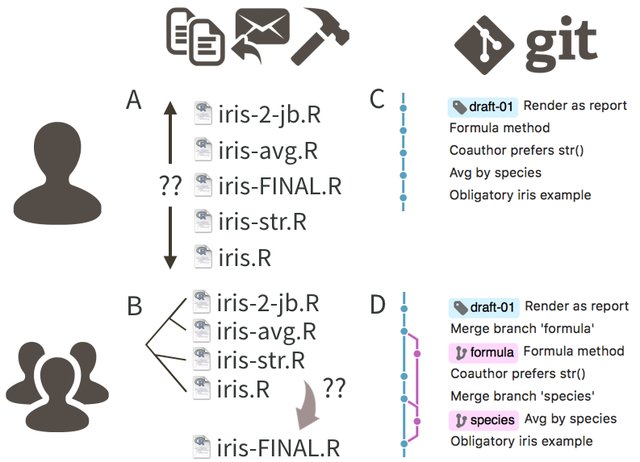
Introduction to git/GitHub
module 1
week 2
programming
version control
git
GitHub
Introduction to your computerʻs terminal utilities
module 1
week 1
programming
filesystem
shell
No matching items